
 Worksheets
Statistics Unit Test
Total questions: 100
Worksheet time: 4hrs 20mins
Define MODE
(a)

How many students are between 56 and 59 inches tall?
(a)

What is the highest score in the class?
(a)

How many total students are in the science class?
(a)

How many students have more than 1,000 songs on their MP3 player?
(a)

How many times did Mary score below a 60 on her tests?
(a)

For how many weeks was the data collected?
(a)

At Donald's Donuts the number of donut holes in a bag can vary. Help Donald find the mode.
12,10,10,10,13,12,11,13,10
(a)

(a)

Which table represents the data in the graph?


(a)

The team scored 50 points. How many points did Kendrick score?
(a)

How many scores are listed in this Stem and Leaf Plot?
(a)

How many students are between 60 and 63 inches tall?
(a)

How many students scored 93% or less?
(a)

How many students received a score of 94%?
(a)

How many total people took the survey?
(a)

What is the mean (average) of this data? Round to the nearest tenth.
(a)

In how many games did the team score more than 20 points?
(a)




What is the interquartile range (IQR)?
(a)

What is the median of the data?
(a)

Which has a greater interquartile range?
(a)

5. Convert the following measurement: 8 kL = (a) L
A baker adds a small amount of vanilla to her cake recipe.
Which unit of liquid volume would best be used?
mililiters
liters

5. Convert the following measurement: 1000 cm = (a) m

kilo, hecto, deci, UNIT, deka, centi, milli
kilo, hecto, deka, UNIT, deci, centi, milli
milli, centi, deci, UNIT, deka, hecto, kilo
5. Convert the following measurement: 5 kl = (a) mm
This prefix is 1,000 times BIGGER than the base unit.
centi-
kilo-
milli-
Who died unexpectedly while drinking chocolate milk?
(a)
5. Convert the following measurement: 1000 cm = _______ m
1
10
100
A baker adds a small amount of vanilla to her cake recipe.
Which unit of liquid volume would best be used?
mililiters
liters
2.3 g = (a) mg

6 cm = (a) mm
(1 cm is 10 mm)

1000 grams = (a) kilograms

Convert 15 m to cm
(1 m = 100 cm)
(a)

15,000 g = (a) kg
(1000 g = 1 kg)

(1 kg is 1000 g)

500 cm = (a) m
(1 m is 100 cm)

200 mm = (a) cm
(1 cm = 10 mm)

1 L = (a) mL

40 cm = (a) mm
( 1 cm = 10 mm)

Convert 17 m to cm:
(1 m = 100 cm)
(a)

7,000 g = (a) kg
(1 kg = 1000 g

(1 cm is 10 mm)
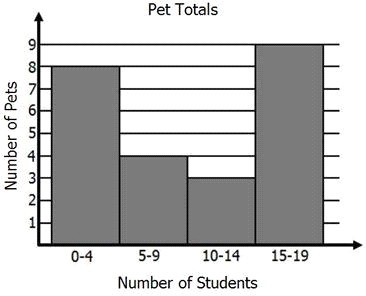
Which interval shows the greatest number of pets?
(a)

Which interval has 400 employees?
(a)

In the last 5 games, Stephen Curry scored 22, 22, 18, 12, and 21 points. What is Curry's Mean (Average) score per game?
(a)
What is MEDIAN
(a)
How do you find the range of a set of data?
(a)
What is the outlier in this set of data?
10,23,11,34,15,16,25,64,37,28
(a)
In statistics, what is another word for MEAN?
(a)

What is the mean of 12, 14, 2, 9, 2, 66, 12, 10
12
14.908
13.78191827
15.875
222.16

Roger bowled 7 games last weekend. His scores are: 155, 165, 138, 172, 127, 193, 142. What is the range of Roger's scores?
(a)
Find the median of 40 50 20 30 60
50
40
20
60
5,11,2,12,4,2
3, 5, 7, 9, 11, 8, 3
median:7 mode:3 range:11
median:6 mode:3 range:7
median:7 mode:3 range:8
7, 1, 1, 7, 1, 4, 1
What is the median of this data?
0, 2, 4, 6, 8, 9
(a)
Find the MODE for the data set: 6, 7, 12, 8, 7, 4, 8, 8, 7
(a)

What was the day with the least amount of cars sold?
(a)

How many people had 3 pets?
(a)
12,14,11,12,18,15,9, 32
What is the outlier?
(a)
What is the range of this data set?
7, 1, 6, 9, 4, 6, 2
8
7
6
5
Q2 is the same as the ______
Mean
Median
Mode
Range
Q1 is the median (middle) of the lower half of the data values.
True
False
What is the IQR of the following Data Set:
32, 35, 35, 36, 39, 40, 44, 48, 49
Q1: 35
Q2: 39
Q3: 46
IQR: 46 - 35 = 11
Q1: 35
Q2: 39
Q3: 44
IQR: 44 - 35 = 9
Q1: 35
Q2: 39
Q3: 48
IQR: 48 - 35 = 13
Q1: 35
Q2: 39
Q3: 46
IQR: 39 - 35 = 4

What is the interquartile range (IQR) of this data?
(a)

If 9 is the mode, what number could k be?
(a)

What is the interquartile range (IQR)?
(a)

What is the range of the data shown?
(a)

Find the median of that data on this frequency table.
20
45
30
18

What are the values for the five number summary?
Min., Q1, Q2, Q3, Max
2,4,6,8,10
0, 3,5,11,20
2, 2.5, 4.5, 10.5, 18
2, 3, 5, 11, 18

How many pieces of data are shown on this dot plot?
(a)

Which statement is best supported by the box plot?
The mean of the data is 85.
There were 98 students included in the data.
The median of the data is 85.
Half of the students scored between 68 and 94.

Which statement is TRUE?
The distribution of the data is clustered around the center.
The line plot shows data spread across a wide range.
The line plot shows two clusters of data.
The line plot has two outliers.

0.5 in
1.6 in
1.7 in
2.3 in

11
12
13
52

5
7
8
12


Germany won twice as many medals as Great Britain.
The United States only won one medal.
Germany won about 15 more medals than Great Britain.
Great Britain won about twice as many medals as The United States.

41
20
15
45

The lowest score on Mrs. Bin's test was about 20%.
The highest score on Mrs. Bin's test was 85%.
Half of the students' scores on Mrs. Bin's test were above 60%.
The interquartile range of the data is 30.
The median of the scores in Mrs. Bin's sixth grade class is 65%.

30
29
31
34

Roger has the following data:
12, 10, 3, 5, 6
Susan has the following data:
5, 9, 4, 5, 6
Who has the data with the highest median and what is it?
Roger - 6
Susan - 7
Roger - 8
Susan - 5.5
What phrase can you use to remember the metrics system?
Dear King Henry Loved Chocolate Milk
Beloved King Henry Died By Chocolate
King Henry Died By Drinking Chocolate Milk
Queen Elizabeth Loved Chocolate Milk And Sleep
275 mm
275 m
.275 m
.0275 mm

