
NEW
Font size
 Worksheets
Review Chapter 7
Total questions: 13
Worksheet time: 7mins
Welfare economics is the study of how
the allocation of resources affects economic well-being
a price ceiling compares to a price floor.
the government helps poor people.
a consumer’s optimal choice affects her demand curve.
Willingness to pay
measures the value that a buyer places on a good.
is the amount a seller actually receives for a good minus the minimum amount the seller is willing to accept.
is the maximum amount a buyer is willing to pay minus the minimum amount a seller is willing to accept
is the amount a buyer is willing to pay for a good minus the amount the buyer actually pays for
Consumer surplus is
the amount a buyer is willing to pay for a good minus the amount the buyer actually pays for it.
the amount a buyer is willing to pay for a good minus the cost of producing the good.
the amount by which the quantity supplied of a good exceeds the quantity demanded of the good.
a buyer's willingness to pay for a good plus the price of the good.
In a market, the marginal buyer is the buyer
whose willingness to pay is higher than that of all other buyers and potential buyers.
whose willingness to pay is lower than that of all other buyers and potential buyers.
who is willing to buy exactly one unit of the good.
who would be the first to leave the market if the price were any higher
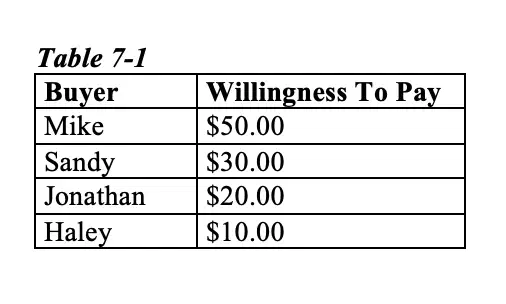
Refer to Table 7-1. If the price of the product is $15, then who would be willing to purchase the product?
Mike
Mike and Sandy
Mike, Sandy, and Jonathan
Mike, Sandy, Jonathan, and Haley

Refer to Table 7-1. If the price of the product is $18, then the total consumer surplus is
$38
$42
$46
$72
Josh is willing to pay $40 for a haircut, but he is able to pay $25 at the local salon. His consumer surplus is
$0 because the cost exceeds his maximum willingness to pay.
$15
$25
$65
If the cost of producing sofas decreases, then consumer surplus in the sofa market will
increase
decrease
remain constant
increase for some buyers and decrease for other buyers
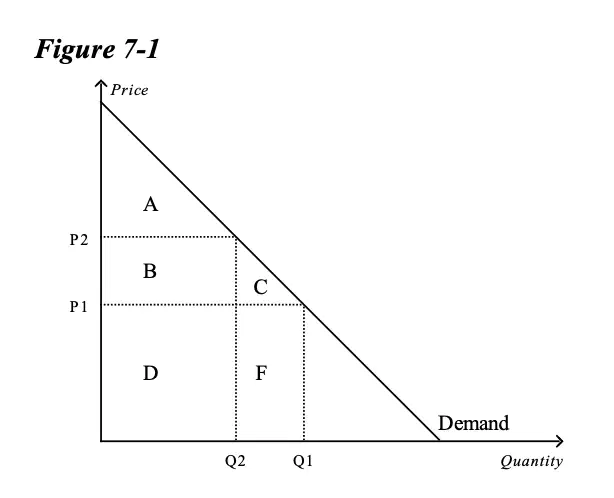
Refer to Figure 7-1. When the price is P1, consumer surplus is
A
A+B
A+B+C
A+B+D

Refer to Figure 7-1. When the price rises from P1 to P2, consumer surplus
increases by an amount equal to A
decreases by an amount equal to B+C
increases by an amount equal to B+C
decreases by an amount equal to C

Refer to Figure 7-1. Area C represents the
decrease in consumer surplus that results from a downward-sloping demand curve.
consumer surplus to new consumers who enter the market when the price falls from P2 to P1.
increase in producer surplus when quantity sold increases from Q2 to Q1
decrease in consumer surplus to each consumer in the market when the price increases from P1 to P2

Refer to Table 7-6. If the market price is $1,000, the producer surplus in the market is
$700
$750
$2,250
$3,700

Refer to Figure 7-8. If the supply curve is S, the demand curve is D, and the equilibrium price is $100, what is the producer surplus?
$625
$1,250
$2,500
$5,000

