
 Worksheets
Math review
Total questions: 204
Worksheet time: 3hrs 52mins

It is a numerical quantity that is assigned to the outcome of an experiment.
Statistics
Probability
Random Variable
Distribution
Two coins are tossed in an experiment. Which of the following list is the sample space?
S= {HH, HT, TH, TT}
S= {HH, TT}
S= { HT, TH, TT}
S= {HH, HT, TT}
TRUE or FALSE: The standard normal distribution of a random variable is a normal distribution with mean =0 and standard deviation =1.
TRUE
FALSE
classify if the distribution in discrete or continuous
1- the number of texts received per week
discrete
continuous
A marketing survey compiled data on the number of cars in households. If X = the number of cars in a randomly selected household, and we omit the rare cases of more than 5 cars, then X has the following probability distribution:
X 0 1 2 3 4 5
P(X) 0.24 0.37 0.20 0.11 0.05 0.03
What is the probability that a randomly chosen household has at least two cars?
0.20
0.29
0.39
0.61
Find the mean of a binomial distribution with n=50 and p=0.4 (μ=np)
50
4
20
10
It is a numerical quantity that is assigned to the outcome of an experiment.
Statistics
Probability
Random Variable
Distribution
It is the set of all possible outcomes in an experiment.
Random Variable
Sample Space
Mean
Data
Two coins are tossed in an experiment. Which of the following list is the sample space?
S= {HH, HT, TH, TT}
S= {HH, TT}
S= { HT, TH, TT}
S= {HH, HT, TT}
Supposed two coins are tossed consecutively and we are interested in the number of heads that will come out. Determine the values of the random variable H (number of heads).
0,2,3,4
0,1,2,3
0,1,2
0,1,2,3,4
Nico label an x- axis with points earned and the corresponding y - axis with the number of players. He plot one against the other and he obtain a bar graph called a what?
(a)
If you had no idea what the answer to this four option multiple choice was and took a wild guess, what is the probability that you are correct?
(a)
Which of the following are the properties of a Normal Probability Distribution.
The distribution curve is bell - shaped.
The curve is symmetric about its center, the mean.
The mean, the median, and the mode coincide at the center.
The area under the curve is 1 or 100%
The tails of the curve is asymptotic to the base line.
TRUE or FALSE: The standard normal distribution of a random variable is a normal distribution with mean =0 and standard deviation =1.
TRUE
FALSE
TRUE or FALSE: The area between 0 and a positive value z is the same as the area between 0 and -z.
TRUE
FALSE
TRUE or FALSE: The area that corresponds to z = 2.58 is the same as the area that corresponds to z = -2.58, which is A = 0.4951
TRUE
FALSE
Find the area that corresponds to z = -1.15
(a)
What is the probability that the value of a standard normal random variable z lies between 0 and 1.28?
(a)
It is the mathematical function that gives the probabilities of occurrence of different possible outcomes for an experiment.
(a)
It is a variable whose value is determined by the outcome of a random experiment.
(a)
It is a random variable whose set of assumed values that is countable.
(a)
A random variable whose set of assumed values that is uncountable, usually arises from measurement.
(a)
It is a number which describes the spread of the distribution.
(a)
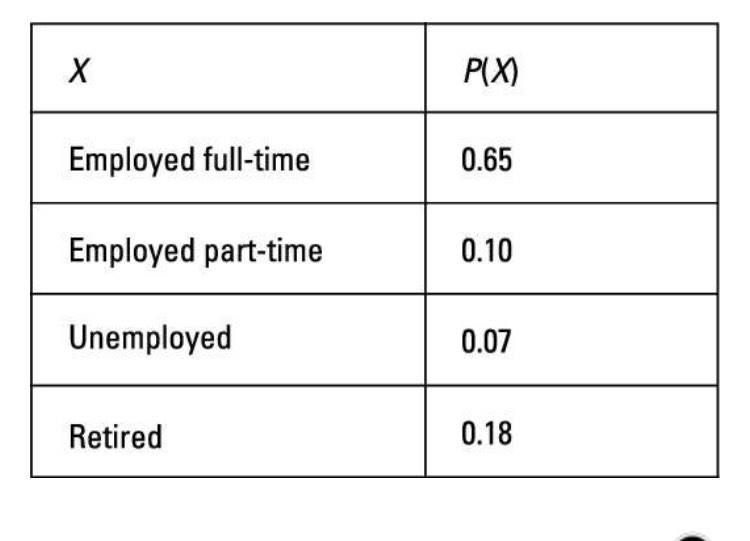
The following table represents the probability distribution X, the employment status of adults in a city.
What is the probability that the adults isn't retired?
(a)
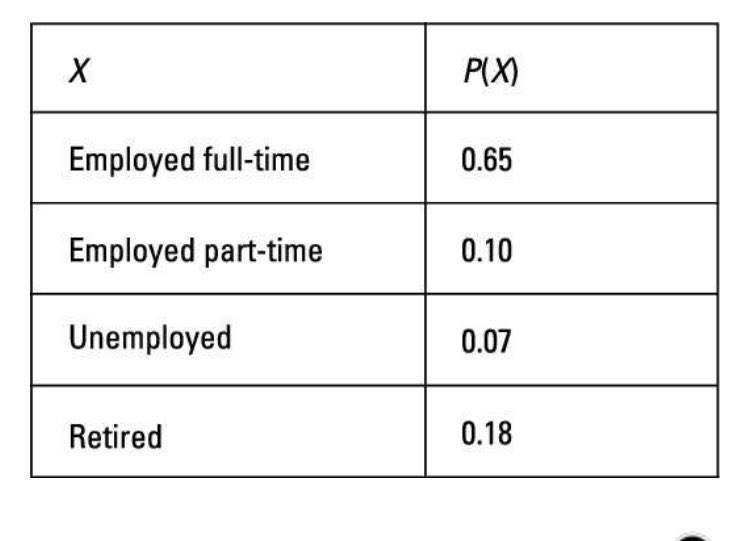
If you select one adult at a random from this community, what is the probability that the adults is employed as part -time?
(a)
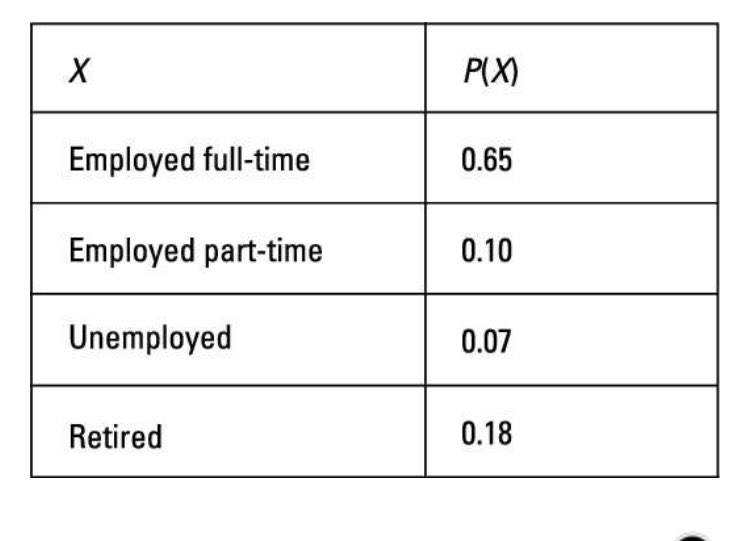
If you select one adult at a random from this community, what is the probability that the adults is working either part - time or full - time?
(a)
Two coins are tossed in an experiment. Which of the following list is the sample space?
S= {HH, HT, TH, TT}
S= {HH, TT}
S= { HT, TH, TT}
S= {HH, HT, TT}
Supposed two coins are tossed consecutively and we are interested in the number of heads that will come out. Determine the values of the random variable H (number of heads).
0,2,3,4
0,1,2,3
0,1,2
0,1,2,3,4
If you had no idea what the answer to this four option multiple choice was and took a wild guess, what is the probability that you are correct?
1
1/2
1/3
1/4
Which of the following are the properties of a Normal Probability Distribution.
The distribution curve is bell - shaped.
The curve is symmetric about its center, the mean.
The mean, the median, and the mode coincide at the center.
The area under the curve is 1 or 100%
All of the above
TRUE or FALSE: The standard normal distribution of a random variable is a normal distribution with mean =0 and standard deviation =1.
TRUE
FALSE
TRUE or FALSE: The area between 0 and a positive value z is the same as the area between 0 and -z.
TRUE
FALSE
TRUE or FALSE: The area that corresponds to z = 2.58 is the same as the area that corresponds to z = -2.58, which is A = 0.4951
TRUE
FALSE
Find the area that corresponds to z = -1.15
0.0596
0.3749
0.3729
0.2088
What is the probability that the value of a standard normal random variable z lies between 0 and 1.28?
29.37%
36.37%
39.97%
49.37%
It is a variable whose value is determined by the outcome of a random experiment.
Random Variable
Discrete
Continuous
Quantitative
It is a random variable whose set of assumed values that is countable.
Discrete Variable
Continuous Variable
Qualitative
All of the above
A random variable whose set of assumed values that is uncountable, usually arises from measurement.
Discrete Variable
Continuous Variable
Qualitative Data
All of the above
It is a number which describes the spread of the distribution.
Statistics
Variance
Standard Deviation
Sigma
If you select one adult at a random from this community, what is the probability that the adults is employed as part -time?
10%
65%
18%
7%
If you select one adult at a random from this community, what is the probability that the adults is working either part - time or full - time?
17%
18%
65%
75%
These kind of observations are made using instruments such as rulers, balances and thermometers.
qualitative
quantitative
These kind of observation use your senses to observe results.
qualitative
quantitative
Probability is...
the likelihood of the occurrence of an event
the name given to any controlled and repeatable process
a set of possible outcomes resulting from a particular experiment
a single specific possible result of an experiment
An Event is...
the likelihood of the occurrence of an event
the name given to any controlled and repeatable process
a set of possible outcomes resulting from a particular experiment
a single specific possible result of an experiment
An Outcome is...
the likelihood of the occurrence of an event
the name given to any controlled and repeatable process
a set of possible outcomes resulting from a particular experiment
a single specific possible result of an experiment
An Experiment is...
the likelihood of the occurrence of an event
the name given to any controlled and repeatable process
a set of possible outcomes resulting from a particular experiment
a single specific possible result of an experiment
An Independent Event is...
the likelihood of the occurrence of an event
not affected by previous events
a set of possible outcomes resulting from a particular experiment
affected by previous events
An Dependent Event is...
the likelihood of the occurrence of an event
not affected by previous events
a set of possible outcomes resulting from a particular experiment
affected by previous events
Gwinnett County Public Schools randomly selected 230 teachers to find out which technology resource is the most effective. 30 teachers chose Safari Montage, 45 selected Learn Zillion, 100 chose Ed Puzzle, and 55 chose Kahoot. GCPS concluded that all teachers prefer Ed Puzzle.
Given a data set with a z score of 4.2, a mean of 3.2 and a standard deviation of 2.8, what is the data point?
11.76
14.96
15.97
-14.99
Given a data point 1.2, a standard deviation of 5.2 and a z-score of -2.0. What is the mean?
11.6
-11.6
3
1

Find the mean (expected value) of the probability distribution.
85
83.2
87.1
84.4
Which of the following is an example of a discrete variable?
Number of red marbles in the basket
Distance traveled between tricycles
Height of the students in a certain class
Weight of student
Let X be the time it takes to finish a one-hour exam. What are the possible values of X (in hours)?
x≤1
0≤x≤1
0<x<1
If a fair coin is tossed twice, what is the probability of seeing heads exactly once?
3/4
1/3
1/2
2/3

Describe the figure.
Normal Curve
Normal Histogram
A normally distributed set of data's graph resembles:
A fire hydrant
A bath tub
A bell
A tree
The sign of the z-score indicates whether the location is above(positive) or below(negative) the mean.
True
False
Total area under the curve of Normal Distribution is equal to ______ .
0.5
1
2
None of the above

0.5404
0.4806
0.5747
0.6802
0.3418
Given a mean of 75 and a standard deviation of 7, what percentage of scores are between 75 and 82?
68%
81.5%
16%
34%
Which of the following is a discrete probability distribution?
The average amount of electricity consumed
The number of patients in a hospital
The amount of paint used in repainting a building
The average weight of female athletes
It is a characteristic that can assume different values.
probability distribution
variable
discrete
nominal
It consist of the values of the random variable can assume and the corresponding probabilities.
Probability
Frequency Distribution
Probability Distribution
Distribution
Which of the following best describes the continuous variable?
Expressed as a whole
Countable
weight
Uncountable
It is the list of all possible outcomes.
probability distribution
disctrete variable
possible outcomes
sample space
Process of collecting, analyzing, interpreting and presenting data.
probability
statistics
variable
none of the above

Find the mean of the probability distribution below.
2.1
2.2
2.3
2.4

What is the percentage of data that falls within two standard deviations of the mean?
95%
68%
100%
99.7%
The Empirical (68-95-99.7) Rule can be applied only if data is ....
Normally Distributed
Skewed
Uniform
Symmetric
Then, 68% of all tires will have a life between ___________ km and __________ km.
About what percent of the products last between 12 and 15 days?

What percent of people within 3 standard deviations of the mean?
99.7
34
68
95
What percent of people within 2 standard deviations of the mean?
99.7
34
68
95
What percent of people within 1 standard deviation of the mean?
99.7
34
68
95


A regular 6-sided die is to be rolled once. What is the probability that a number less than 3 is rolled?
1/3
1/6
1/2
2/3

There are 3 red marbles, 4 blue marbles, 2 green marbles, and 6 clear marbles in a burlap bag. One marble is randomly pulled from the bag. What is the probability the marble was green?
1/2
1/7
2/15
2/17

Given a data set with a z score of 4.2, a mean of 3.2 and a standard deviation of 2.8, what is the data point?
11.76
14.96
15.97
-14.99
Given a data point 1.2, a standard deviation of 5.2 and a z-score of -2.0. What is the mean?
11.6
-11.6
3
1

Is this a probability distribution?
No
Yes
Find the mean (expected value) of the probability distribution.
85
83.2
87.1
84.4
Which of the following is an example of a discrete variable?
Number of red marbles in the basket
Distance traveled between tricycles
Height of the students in a certain class
Weight of student
Let X be the time it takes to finish a one-hour exam. What are the possible values of X (in hours)?
x≤1
0≤x≤1
0<x<1
What is the sample space suppose two coins are tossed?
{HH,HT,TH,TT}
{H,T}
{HH,TT}
{HHH,TTT, HHT, HTH, HTT, THH, THT,TTH}
If a fair coin is tossed twice, what is the probability of seeing heads exactly once?
3/4
1/3
1/2
2/3
Describe the figure.
Normal Curve
Normal Histogram
A normally distributed set of data's graph resembles:
A fire hydrant
A bath tub
A bell
A tree
The sign of the z-score indicates whether the location is above(positive) or below(negative) the mean.
True
False
Total area under the curve of Normal Distribution is equal to (a) .
0.5404
0.4806
0.5747
0.6802
0.3418
Given a mean of 75 and a standard deviation of 7, what percentage of scores are between 75 and 82?
68%
81.5%
16%
34%
A coin is tossed three times. Let W be a random variable giving the number of heads minus the number of tails in three tosses of a coin.
- list the elements of the sample space S for the three tosses of the coin; and
- list all possible values of the random variable W.
(a)
Classify the random variables as DISCRETE or CONTINUOUS.
The number if automobile accidents each year in Lala-an, San Jose.
Discrete
Continuous
Classify the random variables as DISCRETE or CONTINUOUS.
The length of time to play mobile legends
DISCRETE
CONTINUOUS
Classify the random variables as DISCRETE or CONTINUOUS.
The amount of milk produced yearly by a particular cow
DISCRETE
CONTINUOUS
Suppose that your subject teacher is selecting four Senior High School students at random to be interviewed. Let M be Male and F be Female. Let X be the random variable representing the number of female student selected by the teacher.
on your paper create a table presenting the sample space, possible outcome, X, probability distribution with histogram.
(a)
In your own words, What is the difference between Qualitative and Quantitative Data?
What method of collecting data is often called the interview method?
(a)
What method of collecting data is purely based on the subjective remarks of the observer?
(a)
A Researcher wants to conduct a study in a university with 10,000 students. if he wants to use 7% margin of error, how many students must he take as his sample? show solutions on a piece of paper
100 students
200 students
500 students
700 students
in a certain study, 200 samples are taken from the population of 100,000 individuals. the population is divided into strata based on their school. if the distribution of population is as follows CLCST 50,000 students; OLFU 20,000 students and DHVSU 30,000 students. find the sample units per stratum. (show solution on a piece of paper)
(a)
The shape of the Normal Curve is
Circular
Bell Shaped
Spiked
Flat
What is the value in the middle if the data are arrayed from the lowest to the highest value?
Mean
Median
Mode
Variance
Which measures of central tendency is obtained by calculating the sum of values and dividing this figure by dividing the number of values there are in the data set?
Mean
Median
Mode
Variance
What refers to the process of listing all the values of a random variables X together with its associated probability?
random distribution
Normal distribution
Variance
Probability distribution
In probability distribution, the sum of probabilities must be equal to
1/2
2
-1
1
What is the mode number of breaks taken by a worker d during a 10 day period given the following data? 3 ,5 ,9 ,3 ,2 ,2 ,3 ,3 ,1 ,6.
2
3
1
5
The following are the ages of the first ten students who enrolled in a certain college. Find the mean.
23 ,21 ,18 ,17 ,19 ,21 ,20 ,18 ,19 ,24.
2
19
20
21
What refers to the number that tells us how clustered or spread out the values about the mean of a data set?
Standard Deviation
Mean
Median
Mode
Which of the following statistics measures the most frequently occurring value in a set of data?
Mean
Median
Mode
Variance
What is the arithmetic mean of values 2 ,7 ,9 ,8, 3, 18,2 ?
7
8
9
11
What is the standard deviation of the sample of 81 observations With a variance of 121?
11
0
242
6561
Random variables are classified into discrete and
continuous random variable
TRUE
FALSE
P(X=x) means the probability that the
random variable is equal to the specific value of x
TRUE
FALSE
A discrete random variable assigns a whole number to each possible outcome of an experiment.
TRUE
FALSE
The mean of the normal distribution lies at the tail of the normal curve
TRUE
FALSE
Normal Distribution is symmetric is about the variance
TRUE
FALSE
The total area of a bell curve is equal to 0.5
TRUE
FALSE
The ages of the population of a town are normally distributed with mean of 43 and standard deviation of 14. The town has a population of 5,000.
What percentage of ages are between 29 and 43?
34%
68%
13.5%
95%
The ages of the population of a town are normally distributed with mean of 43 and standard deviation of 14. The town has a population of 5,000.
What percentage of ages are between 57 and 71?
13.5%
50%
47.5%
34%
The ages of the population of a town are normally distributed with mean of 43 and standard deviation of 14. The town has a population of 5,000.
ow many people ages between 15 and 43?
2375
2365
2385
Which of the following falls under qualitative data?
gender of a person
average weight of a baby
age of a woman
height of a man
Which of the following falls under quantitative data?
temperature of an object
color of the eye
taste of an ice cream
citizenship
A variable whose value is determined by a random experiment.
random experiment
random variable
statistics
probability
It deals with predicting the likelihood of future events,
random experiment
random variable
statistics
probability
It involves the analysis of the frequency of past events.
random experiment
random variable
statistics
probability
These are variables that are countable in a finite amount of time.
discrete
continuous
tally
events
It can take on an unlimited number of values between the lowest and highest points of measurement.
discrete
continuous
tally
events
It has two or more categories,
but there is no intrinsic order to the
categories.
nominal
interval
ratio
ordinal
It is a type that shows a clear
Ordering of values.
nominal
ordinal
ratio
interval
It is a variable where the difference between the two values is meaningful. It has no Absolute Zero.
nominal
interval
ratio
ordinal
It is a variable that has all the properties of interval variable, but with a clear definition of zero.
nominal
ordinal
interval
ratio
Tell whether given variable is nominal, interval, interval, or ratio. AGE
nominal
ordinal
interval
ratio
Tell whether given variable is nominal, interval, interval, or ratio. TEMPERATURE
nominal
ordinal
interval
ratio
Tell whether given variable is nominal, interval, interval, or ratio. GENDER
nominal
interval
ratio
ordinal
It is the entire group that you want to draw conclusions about.
population
variable
conclusion
sample
It is the specific group that you will collect data from.
population
sample
variable
conclusion
It is a measure of how spread out numbers are. Its symbol is σ (the greek letter sigma).
variance
standard deviation
census
probability mass function
The following is a property of the bell curve except:
it is asymmetric
The mean, mode and median are all equal
The total area under the curve is 1
it is asymptotic

This formula is used to find ________________.
sample variance
sample standard deviation
sample mean
z-score
How many sample space can you get from flipping 4 coins?
8
16
24
32
is a type of inferential statistic used to determine if there is a significant difference between the means of two groups, which may be related in certain features.
(a)
What is half of the total area of the normal curve?
0
0.5
The Philippine Red Cross says that about 11% of the Philippines population has Type B Blood. A blood drive is being held at your school. What is the probability that exactly 5 of the first 10 blood donors has Type B Blood? Solve also for the mean, variance, and standard deviation.
0.22%
0.23%
0.24%
0.25%
The Philippine Red Cross says that about 11% of the Philippines population has Type B Blood. A blood drive is being held at your school. What is the probability that exactly 5 of the first 10 blood donors has Type B Blood? Solve also for the mean, variance, and standard deviation.
1.1
2.2
3.3
4.4
The Philippine Red Cross says that about 11% of the Philippines population has Type B Blood. A blood drive is being held at your school. What is the probability that exactly 5 of the first 10 blood donors has Type B Blood? Solve also for the mean, variance, and standard deviation.
0.976
0.977
0.978
0.979
The Philippine Red Cross says that about 11% of the Philippines population has Type B Blood. A blood drive is being held at your school. What is the probability that exactly 5 of the first 10 blood donors has Type B Blood? Solve for the mean, variance, and standard deviation.
0.99
0.88
0.77
0.66
A survey found that 25% of pet owners had their pets bathed professionally rather than do it themselves. If 18 pet owners are randomly selected, find the probability that exactly 8 people have their pets bathed professionally. Solve also for mean, variance, and standard deviation.
3.76%
4.76%
5.76%
6.76%
A survey found that 25% of pet owners had their pets bathed professionally rather than do it themselves. If 18 pet owners are randomly selected, find the probability that exactly 8 people have their pets bathed professionally. Solve also for mean, variance, and standard deviation.
2.5
3.5
4.5
5.5
A survey found that 25% of pet owners had their pets bathed professionally rather than do it themselves. If 18 pet owners are randomly selected, find the probability that exactly 8 people have their pets bathed professionally. Solve also for mean, variance, and standard deviation.
3.375
4.475
5.575
6.675
A survey found that 25% of pet owners had their pets bathed professionally rather than do it themselves. If 18 pet owners are randomly selected, find the probability that exactly 8 people have their pets bathed professionally. Solve also for mean, variance, and standard deviation.
0.83
1.84
2.85
3.86

What refers to an intelligent guess about a population proportion?
Hypothesis
Test statistic
Decision
Interpretation
Which of the following can be rejected by a statistical test?


What do you call a number that describes a population characteristic?
sample statistic
parameter
variable
decimal
Rejection of the null hypothesis is a conclusive proof that the alternative hypothesis is?
True
False
Either
Neither

What variables that are being predicted or explained?
Independent variables
Dependent variables
Controlled variables
Moderator variables

Which of the following is a discrete random variable?
The weight of Grade 11 students
The number of patients in a hospital
The amount of patients in a hospital
The amount of paint used in repainting a building
If a sample size is 30, which can be used to test a hypothesis about the mean?
t-test
z-test
Either of the two
Neither of the two

Which of the following is not commonly referred to as a measure of central tendency for the normal distribution?
mean
median
midrange
mode

What do you call a continuous, symmetric, and bell-shaped distribution of a variable?
graph
pie chart
line graph
normal curve
What is the graphical representation of bivariate data?


What do you call a random variable with possible values that form a finite or countable set?
continuous
discrete
finite
infinite

What term is used to describe the average value of a discrete random variable over numerous trials of an experiment?
mean
probability
standard deviation
variance

Which of the following represents the amount of spread, dispersion, or variability of the items in a distribution?
mean or expected value
median and mode
outcomes and probability distribution
variance and standard deviation
Which of the following is also equal to the square root of the variance?
mean
median
probability
standard deviation
How would you interpret a very small variance or standard deviation but not equal to zero?
The values of the random variables are farther from the mean.
The values of the random variables are nearer to the mean.
The values of the random variables are equal to the mean.
The values of the random variables have no relationship with the mean.
Which of the following shows most likely the largest possible variance or variability?
number of girls in a randomly selected three-child family
number of newborn babies per minute.
number of Oreo cookies inside a 133 grams pack from different
branch of 711 stores
number of patients who are positive with COVID-19 in different
hospitals
Which of the following data shows most likely the smallest possible variance or variability?
number of books in different branch of National Bookstore
number of books inside a pack bag of grade 11 students
number of books inside the library of different universities
number of books inside the library of different households
What formula is described by σ2 = ∑[x2 * P(x)] − u2?
Which of the following is NOT a property of the variance?
The variance is not equal to the standard deviation.
A small variance means that the distribution of the random variable is narrowly concentrated around the mean.
A large variance means that the distribution is spread out, with some chance of observing values at some distance from the mean.
The value of the variance is less than zero.

Which of the following represents the mean value of a discrete random variable?
Expected value
Median
Standard deviation
Standard deviation

Which of the following is the correct formula to find the expected value of the probability distribution?
E(x) = ∑[x ∙ P(x)]
E(x) = ∑[x2∙ P(x)]
E(x) = ∑[x2 ∙ P(x)] − u2
The total area under the normal curve is


The normal curve is bell-shaped
x
/
sometimes
depends
Which part of the normal curve is extended indefinitely in both directions along the horizontal axis, approaching but never touching it?


According to the property of a Normal Probability Distribution, the mean is equal to what measures of central tendency?
median
mode
both A and B
only A
Which of the following rules state that almost all data fall within the 1, 2, and 3 Standard Deviation of the Mean when the population is normally distributed?
Empirical rule
Lottery rule
Pascal’s triangle rule
Sampling rule
It is used to describe the entire population being studied.
Mean
Population
Statistics
Parameter
A die is rolled. Find the probability that an even number is obtained.
1/2
1/3
3/6
{2,4,6}
Find the mean of:
1, 3, 4, 6, 6, 7, 8
7
5
35
1/7
WHO IS YOUR PRESIDENTIAL BET?
LENI ROBREDO
BONGBONG MARCOS JR.
MANNY PACQUIAO
PING LACSON
ISKO MORENO
The poll on presidential bet is an example of _______.
Population
Parameter
Sample
Statistic
In the bell curve of the normal distribution, the middle part represents the (a) .
The MEAN in the standard normal distribution represents what value?
(a)

THE BELL CURVE SHOWS WHAT KIND OF DISTRIBUTION?
below z = - 1
below z = -1 and
z = 3
above z = - 1
above z = -1 and
z = 3

