
 Worksheets
ENV 3A Population Ecology
Total questions: 47
Worksheet time: 41mins

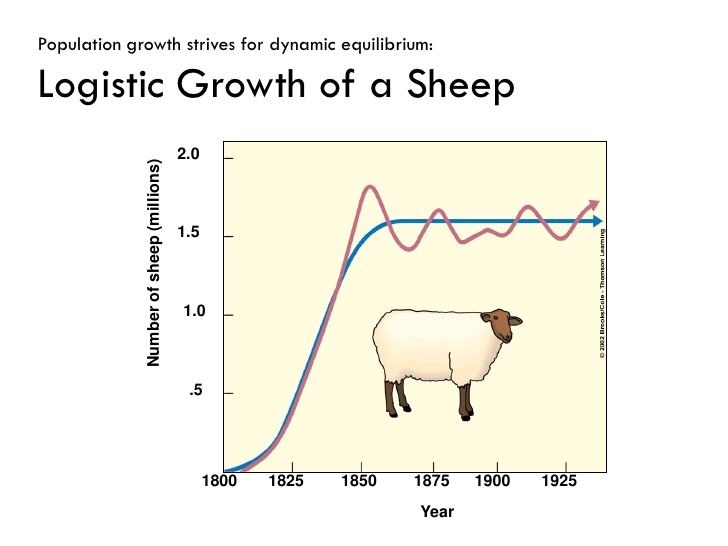
What type of population growth is shown in the graph up above?
Carrying capacity growth
Logistic growth
Exponential growth
Density dependent growth
What pattern of growth will a population with limited resources show?
Logistic
Density-independent
Exponential
Density-dependent
Conditions in the environment that impact the size of the population are called
Populations
Habitats
Niches
Limiting factors

Based on the pie chart above, which events would harm the Georgia Black Bear population?
Restriction on humans hunting bears
Large scale forest fires
Damming lakes and rivers
Introduction of the bald eagle
Which factor is density-dependent limiting factor on the population of a species?
Unusual weather
Natural disasters
Predation
Seasonal variation



Temperature


This graph shows ....
When one population increases, the other decreases.
When one population decreases, the other increases.
When one population increases, the other increases instantly.
When one population increases, it causes the other to increases shortly after.
Match the terms with the types of distribution.
Individuals gather in patches, influenced by resource availability and behavior.
Clumped
Individuals are evenly distributed, influenced by interactions between organisms in the population.
Uniform
Individuals are dispersed throughout the ecosystem with no apparent pattern.
Random
Survivorship curve represented with low death rates during early and middle life, then an increase among older age groups, a good example are humans.
type I
type II
type III
type IV
Survivorship curve represented by a death rate that is constant over organism’s life span, squirrels and songbirds are good examples.
type I
type II
type III
type IV
Survivorship curve represented by high death rates for the young, then a slower death rate for survivors, good examples are fish and frogs.
type I
type II
type III
type IV

What is the arrow pointing at? (a)

What are survivorship curves?
curves that describe the number of survivors over time
curves that tell us what the limiting factors are
curve that tells us about the carrying capacity
a curve
Label the 3 Survivorship Curves.
Type III survivorship curves contain mostly which type of selected species?
K-selected
R-selected
both K and R selected
True or false: Type II is a steadily decreasing survivorship throughout life
True
False
Species that tend to do well in competitive conditions when their population size is near the carrying capacity (K) of their environment. They tend to have long lifespans, reproduce later in life, and produce few offspring. Examples include elephants, whales, humans, saguaro cacti, and most tropical rain forest trees.
k-resistance
r-resistance
k-selected species
r-selected species
Match the terms with the correct definition.
Population Density
The number of people living per unit area.
Population Distribution
How organisms are spread out in an area
Carrying Capacity
The maximum number of individuals that an environment can support.
Population
The total number of individuals in a given area.
Biotic Potential
The maximum reproductive capacity of a species under optimal environmental conditions.

Based on the following image of survivorship curves, a k-strategist would fall into which type of survivorship?
Type 1
Type 2
Type 3
k-strategists are not represented on this graph

The following image would be characterized as...
Random dispersion
Uniform dispersion
Clumped dispersion

One of the biggest reasons invasive species populations grow so rapidly is because...
They're built different
They are better suited for the environment
They have no natural predators
They are evolutionarily more fit
Calculating Growth Rate: Suppose a population of 22 rabbits has produced 47 young in one year. If 11 rabbits have died, what is the growth rate of the rabbit population?
(a)
Calculating Growth Rate: Suppose a population of chipmunks has produced 89 young in one year. If 54 chipmunks have died, what is the change in the population size?
(a)
Calculating Growth Rate: Suppose a population of 259 squirrels has produced 74 young in one year. If 83 squirrels have died, what is the growth rate of the squirrel population?
(a)
When calculating the growth rate, what does it mean when you get a negative number?
(a)
Calculating Population Density: An ecologist counts 480 rabbits in a wheat field that is 80 square meters. What is the population density of the rabbits?
(a)
Calculating Population Density: An ecologist counts 780 grasshoppers in a vegetable garden that is 12 meters long and 5 meters wide. What is the population density of the grasshoppers?
(a)
Match the following:
Population increases as organisms move into a population - (a)
Population decreases as organisms move out of a population - (b)
Population increases as organisms move into a population
Population decreases as organisms move out of a population
Categorize the following as density dependent or density independent limiting factors.
Predation
Hurricane
Organize these options into the right categories
Wide range of tolerance
Small range of tolerance
more adaptable to change
Less adaptable to change
Uses a variety of resources
Specific resource needs
More likely to become endangered
More likely to become invasive
Racoon
Giant Panda
Limiting factors are (a) (b) that (c) a population from continuing to (d) .

Select ALL options that would have a greater impact on the high density population than either the low or medium density populations.
Volcanoes
Hurricane
Parasites
Predation
Space
Select ALL options that would equally impact the high, medium, and low density populations.
Flood
Hurricane
Disease
Predation
Sunlight
Organize these options into the right categories
larger
smaller
Longer Life Span
shorter life span
fewer offspring
many offspring
no parental care
high parental care

