
 Worksheets
Algebra EOC Review
Total questions: 94
Worksheet time: 2hrs 30mins
-5 - 7y = -20y + 34
4x + 3 = -5

{(4,5), (4,-7), (4,2), (4,0), (4,9)}


Given f(x) = -3x - 2 and f(x) = 10. Find x
x = 4
x = -4
x = 8/3
x = -8/3


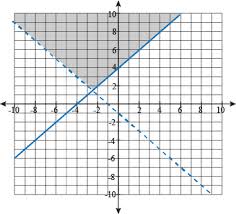
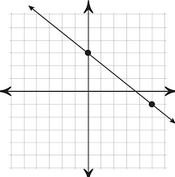
What is the y- intercept of the graph of y = -5x + 6
5
-5
6
-6


What is the equation of 5x -y = 10 in slope intercept form?
y = -5x +10
y =5x-10
y = -x+ 10
y=x-10
Write the equation of the line through the points (−6, −19) and (2, 5).
7x + 2y = 24
3x - y = -11
7x + 2y = -80
3x - y = 1
Graph. y = -4


Graph. x = 1


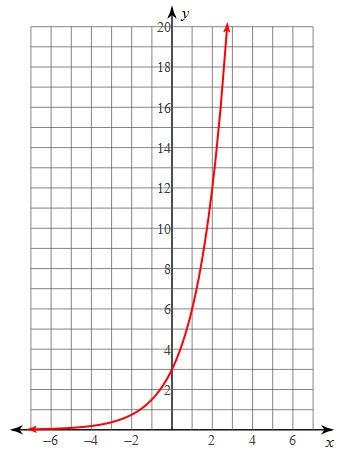
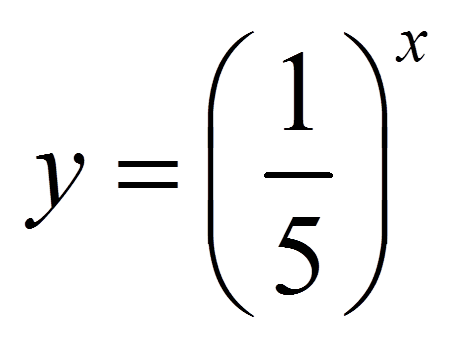
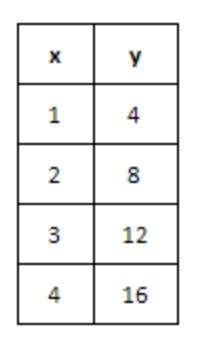
True or False: This is an exponential function.
True
False

Which function models this table?
f(x)=2⋅4x
f(x)=4x
f(x)=4⋅2x
f(x)=8x

What is the equation of the horizontal asymptote for following exponential function?
y = -4
y > -4
y < -4
(0, -3)
97, 86, 75, 64, ...
What is the 100th term in the sequence f(n)= 4n-12
388
40012
-388
100
(5n-8)(5n+8)
(3y2 + y3 - 5) + (4y2 -4y + 2y3 + 8)
(3- 2x + 2x2) - (4x -5 +3x2)

Simplify: 28
47
27
214
74
√10 ⋅ √45
-2√5+3√20
25x2 - 81?
k2 -2k - 24
3x² + 5x - 12
a2 + 2a - 24 = 0
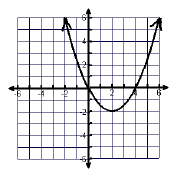

The solutions, roots, x-intercepts, and zeros of a quadratic equation are all the same thing.
(x+10)(x-2) = 0
Which equation shows x2+8x+9=0 after the method of completing the square has been applied?
(x+2)2=−5
(x+4)2=7
(x+8)2=55
x2=−(8x+9)

Identify which part of a parabola is illustrated in the given graph.
vertex
x-intercept
y-intercept
axis of symmetry

Identify which part of a parabola is illustrated in the given graph.
vertex
x-intercept
y-intercept
axis of symmetry

Identify which part of a parabola is illustrated in the given graph.
vertex
x-intercept
y-intercept
axis of symmetry

Identify which part of a parabola is illustrated in the given graph.
vertex
x-intercept
y-intercept
axis of symmetry

Use the graph to find the coordinates of the vertex
(2, -1)
(-1, 2)
(1, -2)
(-2, 1)
Use the graph to find the range of the parabola.
y≥−1
y≤−1
y≥2
y≤2

Use the graph to find the x-intercept/s.
(2, 0)
(0, 2)
(-4, 0)
(0, -4)

A kid launches a rock off of a cliff. The height of the rock after t seconds can be modeled by the graph shown. When does the rock hit the ground?
1.094 seconds
174.141 seconds
155 seconds
4.393 seconds
None of the above
A kid launches a rock off of a cliff. The height of the rock after t seconds can be modeled by the graph shown. What is the maximum height the rock reaches ?
1.094 ft
174.141 ft
155 ft
4.393 ft
None of the above
A kid launches a rock off of a cliff. The height of the rock after t seconds can be modeled by the graph shown. How long does it take the rock to reach its maximum height?
1.094 seconds
174.141 seconds
155 seconds
4.393 seconds
None of the above
What is the mode of the data?
The value that appears the most
The value the appears the least
The average value of the data
The middle value of the data
What is the mean of the data?
The middle value of the data
The average value of the data
The distance between the greatest and least value in the set of data
The value of the data the appears the most
What is the median of the data?
The average value
The most common value
The middle value
The difference between the highest and lowest value
What is the range of the data?
Find the most common value
Find the middle value
Add up all the values in the data then divide by number of values in data
The difference between the highest and lowest values of the data
Find the range of the data 45, 76, 98, 21, 52, 39
108
2
36.5
77
2,2,2,4,4,5,6,6,6,7
90, 100, 95, 85, 60, 80
Find the median of the data.
1,4,6,7,10,20,61,70
7
8.5
9
8


Describe the shape of the distribution.
symmetric
skewed left
skewed right

Describe the shape of the distribution.
symmetric
skewed left
skewed right

Describe the shape of the distribution.
symmetric
skewed left
skewed right

What percent of people who attended the basketball game also attended the school play?
38%
47%
25%
54%

What number should go in the blue box?
21
135
19
22


What is the correlation for the following Scatter Plot.
Weak Positive
No Correlation
Strong Negative
Weak Negative
Strong Positive

What is the correlation for the following Scatter Plot.
Weak Positive
No Correlation
Strong Negative
Weak Negative
Strong Positive

What is the correlation for the following Scatter Plot.
Weak Positive
No Correlation
Strong Negative
Weak Negative
Strong Positive

Given the following Scatter Plot, select the option that is most likely the r value.
r=.27
r=−.862
r=.934
r=.54

Given the following Scatter Plot, select the option that is most likely the r value.
r=−.1
r=−.981
r=.92
r=.765

