
Font size
 Worksheets
Year 7
Total questions: 75
Worksheet time: 57mins
What is tides ?
Rise and fall of ocean water.
Is how high or low the waves speed go.
Is the lowest part of an ocean.
Is the highest part of an ocean.
What cause tides?
Gravitational pull of moon
When a heavenly body blocks light radiation
Gravitational force of sun
Revolving of the earth
How many tides are there ?
1
2
4
11
3
How important are tides?
Draw and label the position of the Sun, Moon and Earth on Neap tide


What do you understand by an eclipse?
A. Partial or total blocking of light of one celestial object by another.
B. Partial or total blocking of light by Moon.
C. Partial or total blocking of light by Earth.
D. Partial or total blocking of light by Sun.
Diamond ring occurs in which type of solar eclipse?
A. Total Solar eclipse
B. Partial Solar eclipse
C. Annular Solar eclipse
D. None of the above
When did Lunar Eclipse happen?
A. Half Moon
B. Full Moon
C. Equinox
D. None of the above

The water cycle is critical to maintaining the Earth's temperature. Without it the Earth's temperature becomes extremely ___ or extremely ____
(a)

Energy from what source (#1 in the picture) drives the water cycle?
Sun
Moon
Wind
Gravity

Water flows on the earth’s surface as a result of precipitation.
evaporation
runoff
condensation
precipitation

When water on the Earth's surface filters through rocks and soil and gathers underground. This process is called...
perspiration
precipitation
infiltration
transpiration

Only about 0.3% of all fresh water is _______.
liquid
gas
visible
salty
A small river that flows into a larger river
Tributary
Valley
Basin
Archipelago
The expanse of salt water that covers most of the earth's surface and surrounds its landmasses
Sea
Valley
Tributary
Basin

Large flat elevated area of land
hill
swamp
plateau
valley

Land that sticks to a lake or ocean
swamp
ithmus
strait
peninsula
a symbol on a map that shows the cardinal directions
river
compass rose
glacier

What are the advantages of Bar Chart and Histogram?
Histogram helps you to display a large amount of data, which is hard to interpret in a tabular form.
Histogram shows the frequency of occurrences of the different data values.
The bar graph displays each data category in a frequency distribution.
Large data set in the visual form helps you to clarify trends better than tables.
How did the expansion of railroads benefit the economy?
Faster transportation and more cities formed
It was cheaper to build railroads
People enjoyed railroads more
It was easy to build railroads

What type of government does Japan have?
Totalitarian Communist
Parliamentary Democracy
Federal Republic
Constitution-based Federal Republic

Which color on your map represented a "democratic" form of a government?
Yellow
Blue
Green

What are two political parties found in India?
Democratic Party and Social Democratic Party
Democratic Party and Republican Party
National Congress and Bharatiya Janata Party

What is a high pressure system?
a weather system that brings fine conditions with little likelihood of rain
a weather system that moves in a west to east direction across Australia
a weather system that moves in a east to west direction across Australia
a weather system that brings extensive rain
a weather system that brings cooler conditions, winds change from a northerly and southerly direction

What does this symbol mean?
Shells
Stones
Mud
Sand
Why did merchants take the risk of moving to California to open shops?
The supplies were scarce and the demand was high
The president encouraged them to
They wanted a challenge
They wanted to move west
What was a prairie schooner?
A type of animal found on the prairies
A type of boat used to transport goods
A type of house most pioneers lived in
A type of covered wagon used on the trails.

Oak Avenue is __________ of Elm Avenue.
north
south
east
west

Describe the characteristics of this landscape. Tick all that apply.
Vegetated
Steep sided
Narrow ridge
Flat mountain top (plateau)

What kind of map is this?
Colour map
Dispersion map
Choropleth map
Pie chart

What is compass direction D?
NW
NE
SW
SE
What is the symbol for "Maritime limit in general, usually implying no permanent physical obstructions"


This indicates.....
Submerged coral reef
Underwater rock of known depth
Underwater rock of unknown depth, dangerous to surface navigation
Rock (islet) which does not cover, height above the plane of reference for elevations
What is the symbol for a deciduous tree?


WHICH IS THIS COUNTRY
SOUTH AFRICA
ANGOLA
INDIA
JAPAN

What is the symbol for "existance doubtful" for depths
SD
ED
REP
REP(1973)

What is the symbol for a deciduous tree?
WHAT WAS THE CAPITAL OF THE MUGHAL EMPIRE
AGRA
NEW DEHLI
HYDRABAD
TOKYO

WHAT IS THE CAPITAL OF GERMANY
MUNICH
BERLIN
LAZIO
OTTAWA
IS IRAN IN AFRICA
NO
YES
What is the symbol for "existance doubtful" for depths
SD
ED
REP
REP(1973)

What causes earthquakes?
Millions of people jumping at once
The earth rotating
The movement of plate tectonics
Gravity

How many major earthquakes, of magnitude 7, happen every year? (take your time to carefully look at the image)
1
18
120
100,000
Where plates meet =
Core
Mantle
Plate boundary
Crust
Convection currents cause tectonic plates to move very
Fast
Slow
All of the following cause breaks in the Earth's crust EXCEPT (select all the correct ones)
plates sliding against one another.
plates crashing together.
plates spreading apart.
plates changing shapes.
The solid centre of the earth. Temperates are up to 6,000° Celsius.
Crust
Inner core
Plate
What happens when plates collide?
Earthquake
Shakey shakey floor
Tsunami

about 200 million years ago something called ? Happened
(a)

Boundary between two plates that are sliding past one another
Transform fault boundary
Convergent boundary
Divergent boundary
Reverse fault
Plate tectonics =
The earth is made up of large moving plates of solid rock
The earth is made up of small plates of hollow rock

Boundary between two plates that are moving apart
Convergent boundary
Transform fault boundary
Sideways boundary
Divergent boundary

On the map, each dot marks the locations of a magnitude 4 or larger earthquake in 5 years. Click on the image. After carefully looking at it, select the places where earthquakes happen often
South East Asia
São Paulo
The Andes (in South America)
Middle-East
Africa


What is the scale used to measure the strengths of earthquakes?
Fujita scale
Richter scale
Damage scale
NASA scale
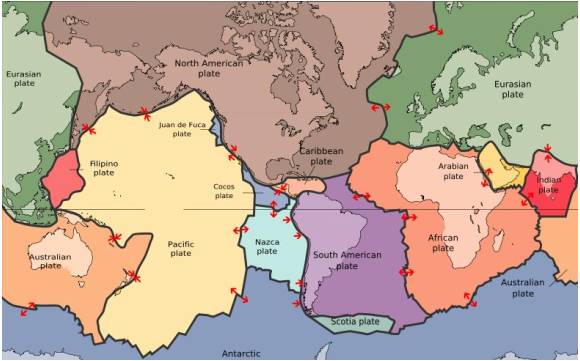
The map in the picture shows tectonic plate boundaries. This map would be useful in predicting the location of future
droughts
hurricanes
earthquakes
tornadoes

about 200 million years ago something called ? Happened
(a)
A large slab of the earth’s crust =
Plate
Plate boundary
Crust
Core
What is the scale used to measure the strengths of earthquakes?
Fujita scale
Richter scale
Damage scale
NASA scale

about 200 million years ago something called ? Happened
(a)
______ consists of hot molten and semi-molten rock known as magma. It moves around in very slow currents.
Mantle
Crust
Core
Boundary between two plates that are sliding past one another
Transform fault boundary
Convergent boundary
Divergent boundary
Reverse fault

The Richter scale measures: (click on the image)
the amount of radon gas released
the movement of plates
the strength of an earthquake
the weight of tectonic plates
The solid centre of the earth. Temperates are up to 6,000° Celsius.
Crust
Inner core
Plate

