
 Worksheets
ECONOMICS - ULTIMATE REVISION
Total questions: 100
Worksheet time: 2hrs 40mins

Which scenario contributes towards the shifting of the curve in the picture above?
When a country is struck by a natural disaster, natural resources are either exhausted or reduced due to the incident.
Huge reduction in Construction Expenses and equipment manufacturing
Economic decline due to Covid 19
None of the above

The following diagram shows the production possibility frontier for an economy that produces bread and honey.
If the economy is initially at point W, then the opportunity cost of moving to point X is
6 units of honey.
8 units of honey.
12 units of bread.
23 units of bread.

What does point B represent?
Production at greater than the country's minimum potential
Production is less than the country's minimum potential
Production is greater than the country's maximum potential
Production at the country's maximum potential
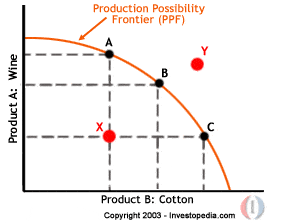
What does PPC show? Select Multiple options.
Describes the production of only two products in economy.
It explains the production when there is full and efficient utilisation all resources in economy
It explains the consumption pattern in economy
It is the combination of all possible output points of two goods given that technology and resources are fixed.

The table shows the production possibilities for a country. Based on the table, which of the following production combinations is a possibility?
5 pairs of shoes and 28 pizzas
3 pairs of shoes and 23 pizzas
2 pairs of shoes and 20 pizzas
4 pairs of shoes and 15 pizzas
What is Production?
Production is the act of creating an output, a good or service which has value and contributes to the utility of individuals.
Production is an activity related to selling or the number of goods or services sold in a given time period.
Production is the quantity of a good that consumers are willing and able to purchase at various prices during a given period of time.
Production is the amount of a resource that firms, producers, labourers, providers of financial assets, or other economic agents are willing and able to provide to the marketplace or directly to another agent in the marketplace.
What is Demand?
Demand is the act of creating an output, a good or service which has value and contributes to the utility of individuals.
Demand is the quantity of a good that consumers are willing and able to purchase at various prices during a given period of time.
Demand is an activity related to selling or the number of goods or services sold in a given time period.
Demand is the amount of a resource that firms, producers, labourers, providers of financial assets, or other economic agents are willing and able to provide to the marketplace or directly to another agent in the marketplace.
What is Supply?
Supply is an activity related to selling or the number of goods or services sold in a given time period.
Supply is the quantity of a good that consumers are willing and able to purchase at various prices during a given period of time.
Supply is the amount of a resource that firms, producers, labourers, providers of financial assets, or other economic agents are willing and able to provide to the marketplace or directly to another agent in the marketplace.
Supply is the act of creating an output, a good or service which has value and contributes to the utility of individuals.
What is Cost?
The amount a producer spends on producing a good or service.
The amount he or she sells the product for.
The actual earning.
When the selling price is less than the cost.
What is Price?
When the selling price is less than the cost
the actual earning
The amount he or she sells the product for
The amount a producer spends on producing a good or service
In terms of Demand, what happens when the price of the products or services increases?
The demand increases.
The quantity demanded decreases.
The quantity demaded increases.
The demand decreases.
Regarding "demand", there's a direct relationship between "price" and "quantity demanded".
True
False
Regarding "supply", there's a direct relationship between "price" and "quantity supplied".
True
False
Regarding "demand", when the price increases, the quantity demanded:
increases too.
decreases.
Regarding "supply", when the price increases, the quantity supplied:
increases too.
decreases.
Regarding supply, what is surplus?
When the quantity supplied is greater than the quantity demanded.
When the quantity demanded is greater than the quantity supplied.
The price of coffee beans decreases significantly. How will this impact the supply side of the market for coffee beans?
The supply will increase.
The supply will decrease.
Supply will not change, but quantity supplied will increase.
Supply will not change, but quantity supplied will decrease.
The price of bananas increase dramatically. How will this affect the demand side of market for bananas?
Demand will increase.
Demand will decrease.
Demand will remain the same, but quantity demanded will increase.
Demand will remain the same, but quantity demanded will decrease.
A change in the price of complimentary goods.
Shift in Supply
Shift in Demand

What does this curve represent?
Supply
Demand
Equillibrium
Quantity
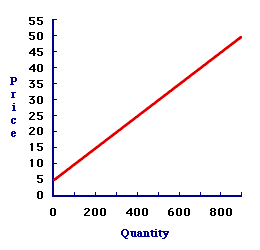
What does this curve represent?
Demand
Supply
Equilibrium
Shortage
In economics, the term demand refers to the quantity of a good that people ...
will buy at one particular price over a long time period
would like to consume on a given date
will buy at many different prices at a particular time
would like to have available during a given time period
When there is a shortage the price will usually?
Rise
Fall
Remain the same
Equilibrium
If the cost of computers falls, then…
the demand for computers goes up.
the supply of computers goes up.
none of the choices
the demand for computers goes down.
Qd = 1700-20P
if P = 80
Qd = 10
Qd = 50
Qd = 100
Qd = 150
Qd = 1700 - 20P
IF Qd = 87
p = 80.60
p = 80.65
p = 80.70
p = 80.75
Qd = 1700 - 20P
If Qd = 367
p = 66.65
p = 65.65
p = 66.55
p = 56.65
Qd = 1700 - 20P
If P = 45
Qd = 800
Qd = 700
Qd = 600
Qd = 500
Qd = 1700 - 20P
if Qd = 400
P = 35
P = 45
P = 55
P = 65
Qs = -250 + 10P
if Qs = 560
P = 80
P = 81
P = 82
P = 83
Qs = -250 + 10P
If P = 46
Qs = 200
Qs = 210
Qs = 220
Qs = 230

What does p1 represent?
Supply
Demand
Shortage
surplus

What does P1 represent
supply
demand
shortage
surplus

What does the graph represent
elastic demand
inelastic demand

What does the graph represent
elastic demand
inelastic demand

What does the graph represent
supply curve
demand curve
shortage
Surplus

$20
$30
$40
$50

A
B
C
D

W only
Z only
W and Z only
W, Y and Z

Between 2003 and 2004, unemployment and prices moved in the same direction.
Prices were at their lowest in 2004
Prices rose continuously over the period
The number of unemployed workers fell over the period

OZ
XY
XZ
YZ

The diagram shows a country’s production possibility curve.
What could allow the economy to move from M to N?
an increase in consumer spending
an increase in demand for exports
an increase in government spending on pensions
an increase in investment

All types of demand followed the same trend.
Industrial use had the greatest fall in demand.
Jewellery and silverware had a continuous increase in demand.
Total demand increased.

Demand is less elastic at higher prices than at lower prices.
Consumer expenditure on the commodity always rises when price falls.
Price elasticity of demand is different at every price
Price elasticity of demand equals one at every price.

A
B
C
D

a higher price and output
a shortage
a surplus
an unchanged price and output

Identify types of price elasticity of demand
Elastic
Inelastic
Unitary Elastic
Perfect Elastic

Identify types of price elasticity of demand
Elastic
Inelastic
Unitary Elastic
Perfect Elastic

Identify types of price elasticity of demand
Elastic
Inelastic
Unitary Elastic
Perfect Elastic

Identify degrees of price elasticity of demand
Ed = ∞
0 < Ed < 1
Ed = 1
Ed = 0

Identify degrees of price elasticity of demand
Ed = 1
0 < Ed < 1
Ed = ∞
Ed = 0
monopoly has two key features, which are
barriers to entry and no close substitutes.
franchises and barriers to entry.
barriers to entry and close substitutes.
close substitutes and no barriers to entry.
A single-price monopoly is characterized by a marginal revenue curve that is
upward sloping.
downward sloping.
horizontal.
vertical.
Which of the following is not a barrier to entry in a monopolized market?
The presence of many buyers and sellers in the market
The government gives a single firm the exclusive right to produce some good.
The costs of production make a single producer more efficient than a large number of producers.
A key resource is owned by a single firm.
A barrier to entry is
an economic term for economies of scale
illegal in most markets
anything that prevents new firms from entering the market
a factor that increases competition
A perfect competitive firm charges a price that is ____________.
different to other firms
higher than other firms
lower than other firms
similar to other firms
If a monopoly firm practices price discrimination the firm will _____________.
earn smaller profit
produce lower quantity than before price discrimination
charge a higher price when demand is inelastic and a lower price when demand is elastic
charge a higher price when demand is elastic and a lower price when demand is inelastic
Patent right for invention leads to
Natural monopoly
Fiscal monopoly
Legal monopoly
Technical monopoly
Under the monopoly MC is
More than the price
Less than the price
Equal to the price
All of the above
In short run, the monopolists
Incurs a loss
Makes a profit
Break even
Any of the above
List the four market structures in the order from least competitive to most competitive.
Oligopoly, Monopoly, Perfect Competition, Monopolistic Competition
Perfect Competition, Oligopoly, Monopoly, Monopolistic Competition
Monopoly, Oligopoly, Monopolistic Competition, Perfect Competition
Monopoly, Monopolistic Competition, Perfect Competition, Oligopoly
Increasing the money supply too quickly > currency loses value > prices increase
The idea that resources are limited
scarcity
supply
demand
inflation
A business organization established, owned and financed by one person is called …………..
Co-operative society
Partnership
Public/private company
Sole proprietorship
The person or organization that decides to go into business is called ………
Entrepreneur
Production
Capital
Self-employed
The reward for labour is …………
Gratitude
Service
Capital
Wages/salaries
The factors of productions are ……………
Land, capital, labour and commerce
Land, capital, commerce and economics
Capital, labour, commerce and economics
Land, labour, capital and entrepreneur
Money citizens or businesses must pay the
government.
Profit
Interest
Taxes
Expenses
A person who provides a good or service
producer
need
want
consumer


According to the pie chart, what uses the most water in a house?
Shower
Faucet
Clothes Washer
Toilet

Kendra earned money by babysitting for 4 months.
Suppose she earned $35 in January. Where would the bar end?
At the $30 line
Halfway between the $20 and $30 lines
Halfway between the $30 and $40 lines
Halfway between the $40 and $50 lines

Mrs. Ratas’ class made a bar graph of the number of pets each student has.
How many students in the class have 3 pets?
4
2
7
5


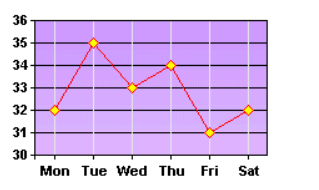
Why is this graph misleading?
broken scale (doesn't start at 0)
uneven values on vertical axis
unequal spacing of lines
none of the above
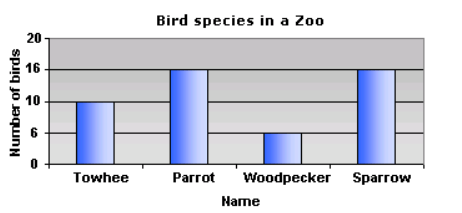
This graph represents the number of different types of bird species in a zoo. Why is it misleading?
broken scale
values on the y axis scale are not uniform (the same)
uneven spacing of values on the y axis
none of the above

What factor of production is he?
(a)

