Wayground logo

Free Printable Worksheets

Font size

S
M
L
XL
Worksheets

Question Bank

Total questions: 42

Worksheet time: 2hrs 12mins

Name
Class
Date
1.

What is the mean of this set of data?

2, 15, 7

a)

24

b)

3

c)

6

d)

8

2.
Find the median of these numbers:
2, 3, 4, 5, 5, 7
a)
4
b)
5
c)
4.5
d)
6
3.
If you score 76, 85, 97, and 83 on your math tests, what would your median score be? 
a)
84
b)
90
c)
85
d)
88
4.
A data set can have more than one median?
a)
True
b)
False
5.
A data set can have more than one mode
a)
True
b)
False
6.

To find the average or mean of a set of numbers, add up all the items and divide by...

a)

2

b)

The minimum

c)

The maximum

d)

The number of items

7.
What is the range?
a)
average
b)
biggest-smallest
c)
the middle #
d)
# happening the most
8.
What is the mode?
a)
# happening the most
b)
the average
c)
biggest - smallest
d)
the middle #
9.
Find the range.
5, 15, 10, 20, 15, 10, 15
a)
5
b)
10
c)
15
d)
13
10.

Find the median, mode and range:

3, 5, 7, 9, 11, 8, 3

a)

median:7 mode:9 range:8

b)

median:6 mode:3 range:7

c)

median:7 mode:3 range:8

11.

Calculate the MODE for the data set: 6, 7, 12, 8, 7, 4, 8, 8, 7

a)

7

b)

7.44

c)

8

d)

7 and 8

12.

What is the mean (average) of this data? Round to the nearest tenth.

a)

8.0

b)

8.3

c)

7.5

d)

9.0

13.

Median of the first 10 natural numbers

a)

5

b)

6

c)

5.5

d)

11

14.

The mean of first 5 natural numbers

a)

5

b)

15

c)

3

d)

2.5

15.

Which of the following is not a measure of central tendency

a)

Mean

b)

Range

c)

Median

d)

Mode

16.
How many people have two or less books in their desk?
a)
4
b)
5
c)
6
d)
7
17.
Roger bowled 7 games last weekend. His scores are: 155, 165, 138, 172, 127, 193, 142. What is the range of Roger's scores?
a)
193
b)
127
c)
60
d)
66
18.
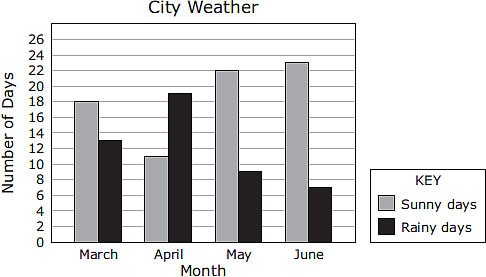
The graph below shows the number of sunny days and rainy days in a city during four months.

Based on the graph,how many more sunny days than rainy days did this city have during the months of April, May, and June?
a)
21
b)
56
c)
26
d)
20
19.
How many people purchased no food and no drink?
a)
60
b)
10
c)
20
d)
200
20.
How many students spent over 40 minutes but under 60 minutes studying?
a)
22 Students
b)
30 Students
c)
8 Students
d)
5 Students
21.
How many total people took the survey?
a)
50
b)
150
c)
100
d)
200
22.
What is the highest score in the class?
a)
88%
b)
100%
c)
13
d)
98%
23.
How many students scored 93% or less?
a)
6
b)
16
c)
14
d)
13
24.
Which interval has 400 employees?
a)
33-43
b)
0-10
c)
77-87
d)
66-76
25.
How many students are between 60 and 63 inches tall?
a)
3
b)
0
c)
12
d)
7
26.
How many students have more than 1,000 songs on their MP3 player?
a)
5
b)
16
c)
10
d)
4
27.
What is an interval?
a)
A single number
b)
A range of numbers
c)
A percentage
d)
A total amount
28.
The team scored 50 points. How many points did Kendrick score?
a)
12 points
b)
20 points
c)
10 points
d)
72 points
29.
What type of correlation does this scatter plot show?
a)
positive linear association
b)
negative linear association
c)
no association
d)
nonlinear association
30.
You are analyzing a scatter plot that has a negative correlation. What is true of the of the x and y values?
a)
As x increases, y decreases
b)
As x increases, y increases
c)
As x decreases, y decreases
31.
What is the MEAN for this data?
a)
80
b)
1040
c)
13
d)
81
32.

The graph shows how employees at Disney World travel to work. How many employees ride bikes, ride the bus, or walk to work?

a)

300

b)

450

c)

325

d)

375

33.
What is the maximum value?
a)
58
b)
66
c)
64
d)
60
34.
Which fitness club has the greater range?
a)
Fun Fit
b)
Greg's Gym
c)
Neither
35.

If the median of the data 4, 7, x-1, x-3, 16, 25 written in ascending order is 13 then x is equal to

a)

13

b)

14

c)

15

d)

16

36.

In the class interval 50-55 what is the Upper limit?

a)

50

b)

55

c)

49.5

d)

54.9

37.

In a frequency distribution the class having maximum frequency is called the modal class

a)

TRUE

b)

FALSE

38.

How is the data distributed in this histogram?

a)

Symmetrically

b)

Skewed Right

c)

Skewed Left

39.

How is the data distributed in this histogram?

a)

Symmetrically

b)

Skewed Right

c)

Skewed Left

40.

What does the standard deviation tell us about the data set?

a)

How spread out the numbers are

b)

How much each number in the data set increases by

c)

How much each number in the data set decreases by

41.

What is normal distribution?

a)

A symmetrical bell-shaped graph

b)

A graph that is skewed to the right

c)

A graph that is skewed to the left

42.

What percent of data lies within 1 standard deviation from the mean?

a)

95%

b)

99%

c)

68%

d)

100%