
Font size
 Worksheets
MT1 Review
Total questions: 23
Worksheet time: 10mins
How do you create a list?
L = (
L = {
L = <
L = [
Which function calculates the mean of a data set?
mean[L]
mean=L
mean(L)
meanL
What does this symbol represent: σ
IQR
Standard Deviation
Median
Range
Which function calculates the median of a data set? Choose all that apply.
mean(L)
max(L) - min(L)
dotplot(L)
stats(L)
How do you calculate the IQR of a data set?
Q3(L)-Q1(L)
stats(L) → max-min
max(L)-min(L)
stats(L) → Q3-Q1

What is the value of the median in the given box plot?
12
19
14
16
How do you identify an outlier?
Create a box plot
Create a dot plot
Use the extreme value formulas
Choose the largest number
How do you input bivariate data into Desmos?
Make two lists
Make a table
Make one combined list
Which model(s) are used to analyze bivariate data? Choose all that apply.
dot plot
histogram
box plot
scatter plot
Complete the statement: "If the x-values are increasing and the y-values are decreasing in a scatter plot, then the correlation is _."
(a)
If a scatter plot displays a positive and strong correlation, then the correlation coefficient is closer to what value?
+1
+0.5
0
-0.5
-1

Determine the correlation coefficient for the bivariate data set.
+1
+0.5
0
-0.5
-1
What does the mean represent in a data set?
The average value
The middle value
The size of the data set
The measure of variability
The range for the centers
What does the range represent in a data set?
The average value
The middle value
The size of the data set
The measure of variability
The range for the centers
What does the standard deviation represent in a data set? Choose all that apply.
The average value
The average distance from the mean
The size of the data set
The measure of variability
A high outlier value will likely cause . . .
Choose all that apply.
a decrease in variability
an increase in variability
and increase in average values
a decrease in the spread
Which variable is a higher financial risk?
Variable A Mean = $112.86/day
Variable B Mean = $547.65/week
Variable A
Variable B
Which formula is used to plot the line of best fit?
y1 = mx1 + b
y ~ mx + b
y1 ~ mx1 + b
y = mx + b
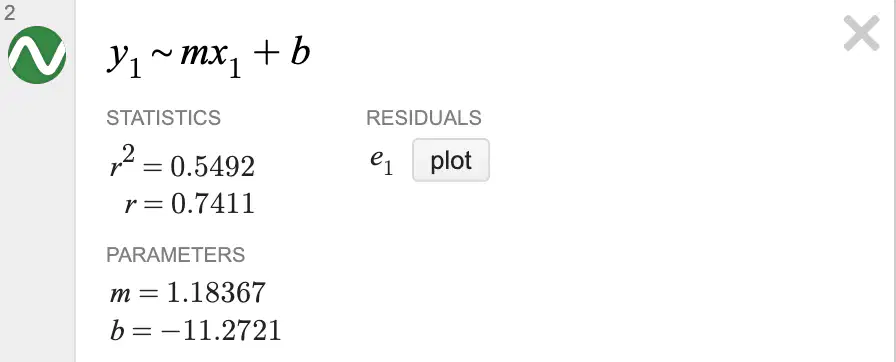
Is the following bivariate set displaying a strong or weak correlation?
strong
weak
How can you make a prediction for an unknown bivariate value?
Input "x=_" and click on the intersection point
Input Input "y=_" and click on the intersection point
The prediction is equal to the r2 value
The prediction is equal to the b value
What makes a predicted value reliable?
If the data has a positive correlation
If the data has a negative correlation
If the data has a strong correlation
If the data has no correlation
Which Score 2 Learning Target do you feel MOST confident on? Choose only one for now.
SC2LT1: Calculating measures of center & spread
SC2LT2: Modeling univariate and bivariate data sets
SC2LT3: Determining the correlation between bivariate variables
Which Score 3 Learning Target do you feel MOST confident on? Choose only one for now.
SC3LT1: Analyzing/Interpreting effects of outliers
SC3LT2: Assessing risk and drawing conclusions
SC3LT3: Use linear regression to predict unknown values

