
Font size
 Worksheets
PPC - S3_Revision
Total questions: 50
Worksheet time: 38mins

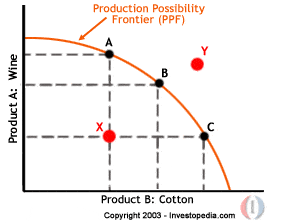
If a point lies on the curve this means the company/country/individual is being efficient. If a point lies inside the curve, what does that tell?
They are being over efficient
They are being inefficient
It is not impossible with the given resources
They are still efficient, just at another point

What does point B represent?
Production at greater than the country's minimum potential
Production is less than the country's minimum potential
Production is greater than the country's maximum potential
Production at the country's maximum potential

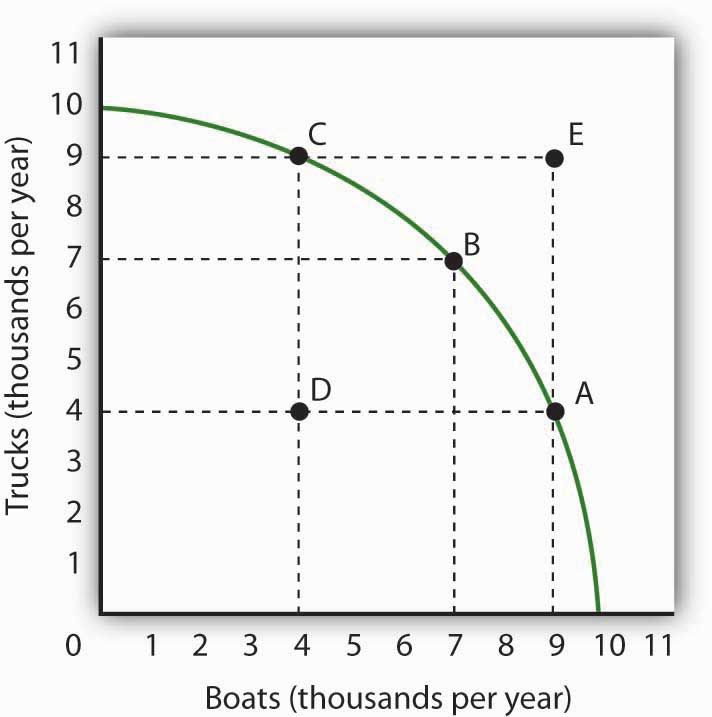
Which letter represents the O.C. of moving from A to G?
H
I
M
K
L
Which letter represents the O.C. of moving from C to E?
H
I
J
K
L
Which letter represents the O.C. of moving from E to C?
H
I
J
K
L
Which letter represents the O.C. of moving from F to A?
H
I
M
K
L
Which letter represents the O.C. of moving from G to A?
H
I
M
K
L
What is the O.C. of moving from E to C?
100 Ipads
200 Iphones
150 Ipads
100 Iphones
What is the O.C. of moving from B to D?
100 Ipads
200 Iphones
150 Ipads
100 Iphones
What is the O.C. of moving from F to B?
200 Ipads
400 Iphones
300 Ipads
200 Iphones

What is the Opportunity Cost of moving from C to A?
(a)
What is the Opportunity Cost of moving from B to E?
(a)
What is the Opportunity Cost of moving from C to A? (Think in the terms of what do we have to forgo in the process.)
(a)
What does PPC show? Select Multiple options.
Describes the production of only two products in economy.
It explains the production when there is full and efficient utilisation all resources in economy
It explains the consumption pattern in economy
It is the combination of all possible output points of two goods given that technology and resources are fixed.

Which of the following are the choices in case the technology is fixed and all resources are efficiently employed. Choose the correct option/s.
G
C
A
E
B
A trade-off is
always in the social interest
the benefit you receive from an increase in an activity
giving up one thing to get something else
the key to reconciling self-interest and social interest
Which of the following pairs does not match?
Labour and wages
Land and rent
Entrepreneurship and profit
Capital and profit
Assume that a firm can produce 6 units of good X or 12 units of good Y per hour with its current resources. The opportunity cost of a unit of X is:
72 units of Y
12 units of Y
6 units of Y
2 units of Y
Resources in an economy:
Are always fixed.
Are limited at any moment in time.
Always increase over time.
Can never decrease
The sacrifice involved when you choose a particular course of action is called the:
Alternative
Consumer cost
Opportunity cost
Producer cost
If an economy is productively efficient:
More of one product can only be produced if less of another product is produced
The distribution of income is equal
Everyone is wealthy
Resources are unemployed
Economic growth can be shown by:
An inward shift of the production possibility frontier
A movement downward the production possibility frontier
A movement up the production possibility frontier
An outward shift of the production possibility frontier

Which scenario contributes towards the shifting of the curve in the picture above?
When a country is struck by a natural disaster, natural resources are either exhausted or reduced due to the incident.
A population increase leads to increasing numbers of buyers and school admission.
Economic decline due to Covid 19
Inflation occurs and the price of goods had increased to support Malaysia's economy
Which of the following does NOT illustrate opportunity cost?
I should buy a book rather than a food
If I buy a computer, I must do without a 35” television
If I spend a lot now means I will spend more in the future
If I study today, I must give up going to the football game
Which scenario contributes towards the shifting of the curve in the picture above?
When a country is struck by a natural disaster, natural resources are either exhausted or reduced due to the incident.
Huge reduction in Construction Expenses and equipment manufacturing
Economic decline due to Covid 19
None of the above

The following diagram shows the production possibility frontier for an economy that produces bread and honey.
If the economy is initially at point W, then the opportunity cost of moving to point X is
6 units of honey.
8 units of honey.
12 units of bread.
23 units of bread.

If there is improved technique of Production in both the goods , how will the PPC be affected?
Leftward shift of PPC
Rightward shift of PPC
Rotation of PPC
None of the above
A country experiences a fall in unemployment. How would this be shown on a PPC diagram?
A movement of the production point away from the curve
A movement of the production point towards the curve
A shift of the PPC to the left
A shift of the PPC to the right

Points B, D, and C represent ___________ use of resources.
Ineffecient
Efficient
Unfeasible

Point X represents an amount of production which is __________.
Unfeasible
Inefficient
Efficient
Well thought out

Point A represents an __________ use of resources.
Smart
Inefficient
Efficient
Unfeasible

