
Font size
 Worksheets
BBC Statistical Literacy
Total questions: 33
Worksheet time: 39mins
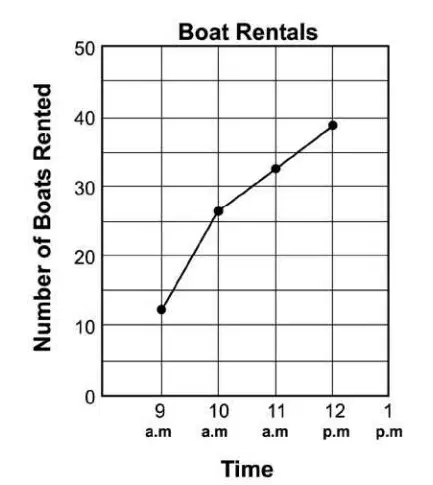
What is the closest number of boats being rented at 11am?
26 boats
33 boats
38 boats
39 boats
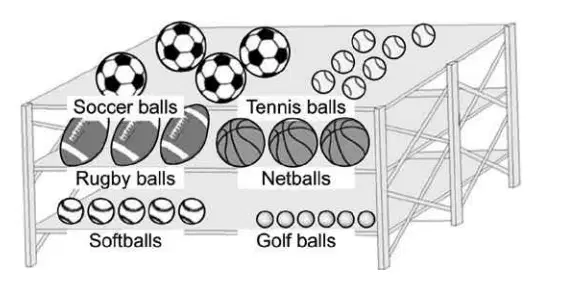
3 students counted all the balls in the PE shed.
Is the data discrete or continuous?
Discrete
Continuous
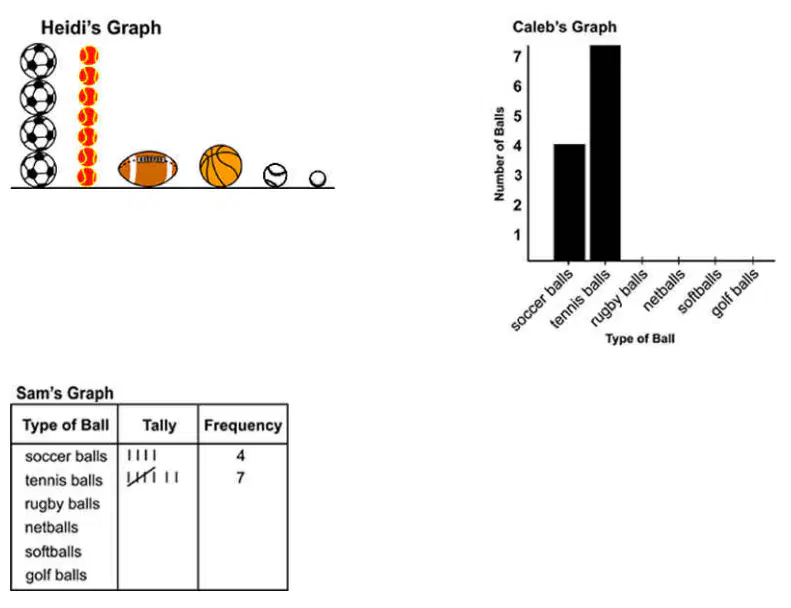
Which type of picture would present the clearest information about the number of each type of ball?
Pictogram
Bar graph
Tally table
None of them
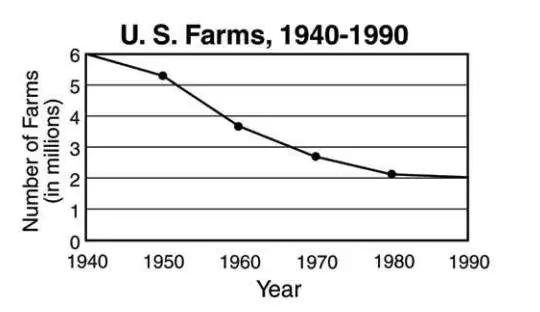
What is the most likely number of farms in 1975?
2,500,000
25,000,000
2,500,000,000
25,000,000,000
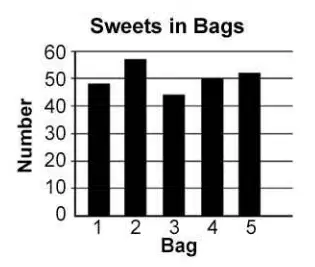
The number of sweets in the bags is about
40
55
50
60
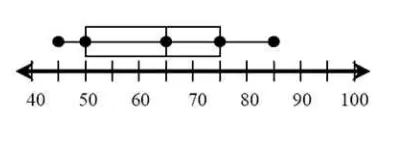
What is the median of this data?
75
65
60
50
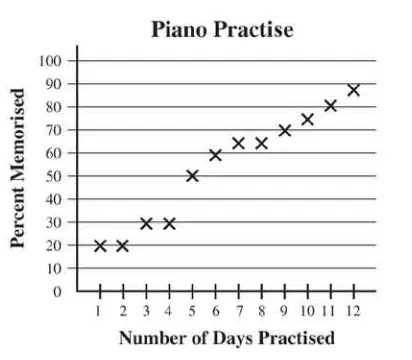
How many days of practice did it take for Regina to memorise half the song?
5
6
7
8
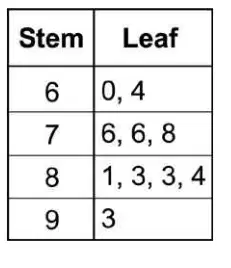
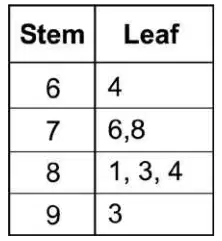
The stem and leaf shows the marks Jack got on his tests this year.
(a) is the lowest mark he got.
The stem and leaf shows the marks Jack got on his tests this year.
How many tests did he sit?
(a)
The stem and leaf shows the marks Jill got on her tests this year.
(a) is the median mark.
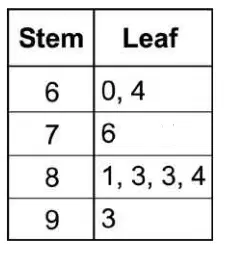
The mode is (a)
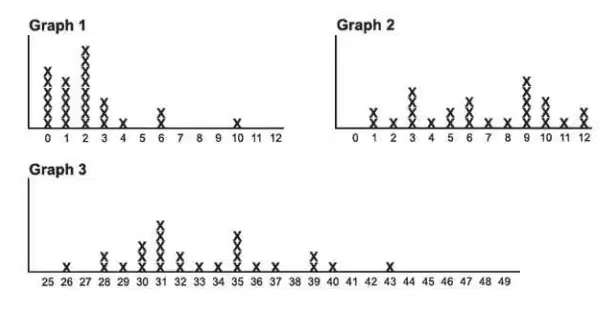
Which graph would most likely be titled : Number of brothers or sisters
Graph 1
Graph 2
Graph 3




Which of the box plots has the larger interquartile range (spread)?
female
male
they're the same
impossible to tell


Describe the shape of the graph.
Bell Shape
Bimodal
Uniform
Left Skewed

How would you describe this data?
Skewed Left
Skewed Right
Symmetrical
A total amount
4,2,7,4,3
7, 1, 1, 7, 1, 4, 1
The time it takes for a car battery to die. Is this data discrete or continuous?
Discrete
Continuous
The number of school lunches sold during the month. Is this data discrete or continuous?
Discrete
Continuous
How many miles it takes to use up a tank of gas. Is this data discrete or continuous?
Discrete
Continuous
Number of slices on a pizza. Is this data discrete or continuous?
Discrete
Continuous


How many employees make between $45 and $55 per hour?
2
5
7
8

How many employees make less than $45 per hour?
3
4
8
10

What is the total number of employees?
5
6
15
13

What is the IQR of the data?
0.2
2
0.8
0.9
$78, $79, $81, $82, $83
Two days later, another store has the same shoes on sale for $65. How does the new price affect the data?

