
 Worksheets
M&C Unit 1 Test Review
Total questions: 198
Worksheet time: 4hrs 9mins
If a laboratory fire erupts, immediately _________.
Run for the fire extinguisher.
Notify your instructor.
Throw water on the fire.
Open the windows.
You are heating a substance in a test tube. Always point the open end of the test tube ________.
Toward yourself.
Toward your lab partner.
Toward another classmate.
Away from all people.
True or False:
Return all unused chemicals to their original containers.
True
False
Hot glass looks the same as cold glass.
True
False

After completing an experiment, all wastes should be
taken home
tossed in the trash can
disposed of according to your teacher's directions
left out for someone else to clean

Approved eye protection devices (such as goggles) are worn in the laboratory
to avoid eye strain
to improve your vision
so that you look super cool
any time chemicals, heat or glassware are used
Never remove chemicals, specimens, or other equipment from the laboratory.
True
False
in the lab, you should NEVER
taste substances being used
wear your goggles
pull your hair up if its long
wear close-toed shoes

When you finish working with chemicals, biological specimens, etc., always
treat your hands with skin lotion.
wash your hands thoroughly with soap and water.
wipe your hands on a towel.
wipe your hands on your clothes.
You are heating a piece of glass and now want to pick it up. You should
use a rag or paper towels.
pick up the end that looks cooler.
use tongs.
pour cold water on it.
If you are injured in the laboratory, you should first
visit the nurse after class.
see a doctor after school.
notify your science instructor.
apply first aid yourself.
Chipped or cracked glassware is okay to use in the laboratory.
True
False

Which of these should you do in the lab?
listen to all instructions before starting the lab
let your teacher know if there is a problem
do only the experiment the teacher instructs you to do
all of these
What piece of equipment (tool) is used to measure volume with the most precision?
Beaker


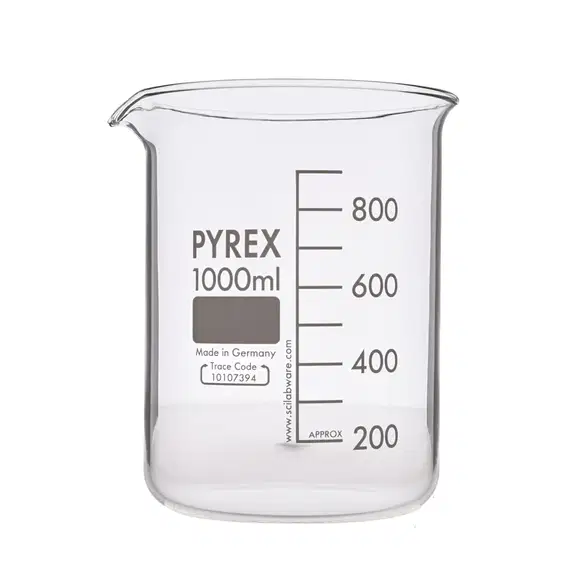

What is the volume of the liquid?

What is the volume of the liquid?
8.42mL

What is the length of the green bar?

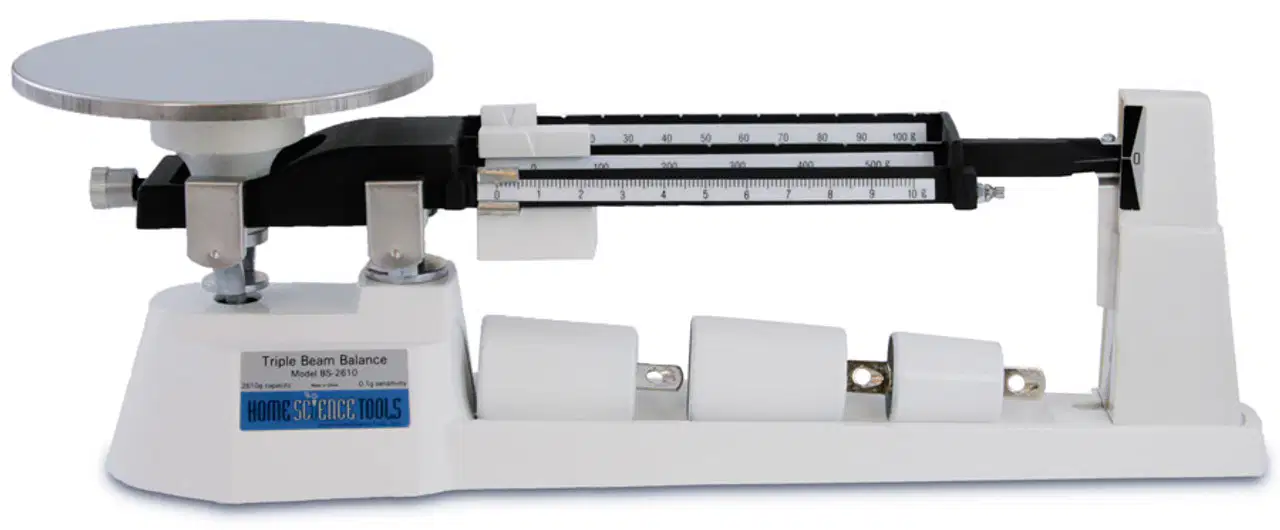
If the beams are balanced with the riders in the positions shown, what is the mass of the object?

What is the volume of the liquid?
A student calculates the density of a substance as 1.40 mLg . The accepted value of the density is 1.30 mLg . What is the percent error of the student's measurement rounded to the hundredth place (2 decimal places)?
(a)
Rank the units from largest to smallest
kilometer
meter
centimeter
millimeter

The basic unit of volume in the metric system is
gram.
liter.
second.
meter.
What is volume?
the measure of the force of gravity
a measure of the energy of motion of the particles in a substance
the amount of space taken up by an object or substance
the measure of how much mass is contained in a given space
What is the base metric unit for length?
m
N
kg
ml

What is the volume of the ring?
64.0 mL
68.0 mL
4 mL
4.0 mL

40.09g
40.1g
What is the base metric unit for mass?
What is the base metric unit for temperature?

What is the length of the colored pencil?
41.6
41
42
41.50

What is the length of the grey bar?
87 mm
87.4 mm
87.40 mm
87.400 mm

What is the length of the red bar?
8.5 cm
8.45 cm
8.450 cm
8 cm


1,000,000
1.0
0.0156
156
0.156
57
900 cm ____ 9000 mm
<
=
>
Select the largest unit.
kilogram
centigram
decigram
decagram
762 cL = _____ L
7.62
0.762
76.2
7,620
3.85 hg = _____ cg
38,500
3,850
38.5
0.000385
Mr. Sheridan estimates it will take him 48 minutes to run 8 miles. It actually takes him 60 minutes. What was the percent error in his estimation?
8%
12%
20%
25%
80%
Mr. Sheridan estimates it will take him 60 minutes to run 8 miles. It actually takes him 48 minutes. What was the percent error in his estimation?
8%
12%
20%
25%
80%
The attendance for the basketball game was estimated to be 15,000 people but 12,500 people attended. What was the percent error?
16.67%
20%
2500%
80%
The students measured length during a science experiement, they got 12 cm. But the actual measurement was 14.25 cm. What was the percent error?
16%
18.75%
2.25%
18%
Students worked in teams to measure the length of an object. The actual length of the object was 7.0 cm.. Select the best choice that represents their data in terms of accuracy and precision
GROUP RESULTS
5.00 cm
5.01 cm
5.02cm
4.99 cm
5.00 cm
4.99 cm
both accurate and precise
only accurate
only precise
not accurate and not precise
Accuracy is
How close measurements are to the true value
How close together measurements are to each other
Precision is
How close measurements are to the true value
How close together measurements are to each other
The more significant figures our instrument can read to, the more accurate our data
True
False


Which is the more precise measurement?
4 mL
4.3 mL
4.30 mL
4.300 mL
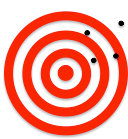
A student measures 28mL but the correct volume is 25mL. What is their percent error?
12%
-12%
3%
-3%

Which student had the more accurate results?
Student A
Student B
Student C
Cannot be determined

What conclusion can be made from this graph?
The gummy bear did not change mass after 24 hours of being submerged in water.
The gummy bear grew the longest in length after being submerged in vinegar.
Gummy bears change color when they are submerged in different liquids.

What conclusions can you draw from this graph?
The deer population went down over time.
The deer population went up over time.
The dear population went up quickly, then down, but then stayed the same.

Name a controlled variable (constant) for this experiment.
the type of solution in each container
The amount of solution used in each container
the length of the gummy bear after it was submerged

What is the independent variable of this experiment based on this graph?
the color of the gummy bear
the different types of solutions used to submerge the gummy bears.
the length of the gummy bears after they were submerged in different liquids

T8 - What does this graph show?
Number of bacteria on your skin.
How different bacteria cultures grow over time
Type of Bacteria

The purpose of this study was to discover
Does water depth affect temperature?
Does water depth affect the number of fish?
Does temperature affect the water depth?
The students measured length during a science experiment, they got 12 cm. But the actual measurement was 14.25 cm. What was the percent error?
15.79%
18.75%
2.25%
18%

Anjuli performed an experiment to determine the respiration rate of yeast. She determined this by measuring carbon dioxide (CO2) production over time. Then, she produced the following graph.
Her teacher suggested that she redraw her graph as a line graph. Why should she redraw the graph?
A line graph looks better in a scientific report.
She was measuring a rate of change.
She had graphed the wrong relationship.
Her experiment had many different variables.
Maria wanted to learn more about the birds that visit her backyard. She installed several bird feeders and offered the same variety of bird seed mixes in each feeder in order to attract a mix of bird species. For a month, she observed the bird feeders three times a day for an hour each day and counted the types of birds that visited the feeders. Then, she made a pie chart to compare the numbers of birds of each species that visited the feeders.
What is the most likely reason that she chose a pie chart?
To show the total number of birds that she observed.
To show the number of times that each bird visited the feeders.
To show which bird species were most common.
To show how the bird species changed over time.
The horizontal axis is the _________
X axis
Y axis
Z axis
A axis
The vertical axis is the ___________
X axis
Y axis
Z axis
A axis
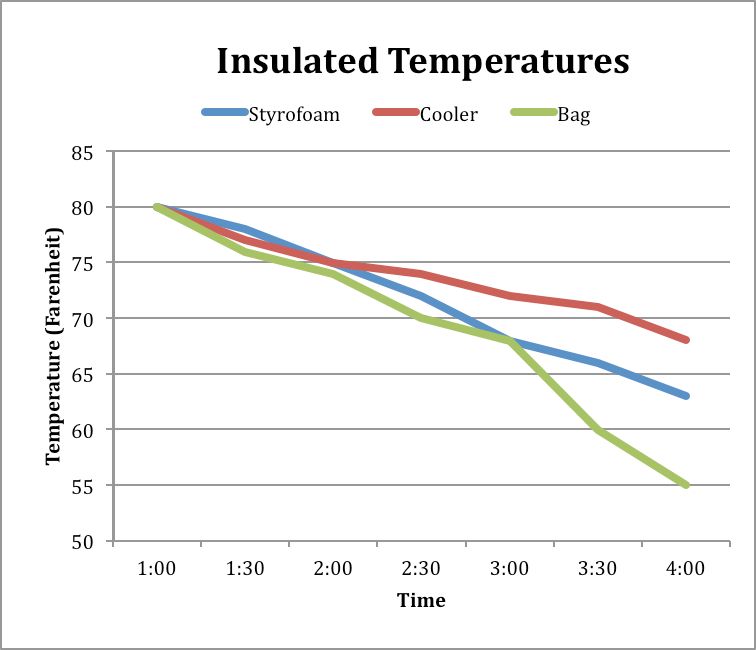
What data does this graph represent?
Change in temperature of a liquid over time in 3 different containers
How temperature can change the molecules in a material
The phase changes of a material
What type of container people use the most to store hot liquids.

Which type of container keeps liquid the hottest for the longest time?
Bag
Cooler
Cooler and bag are tied
Styrofoam
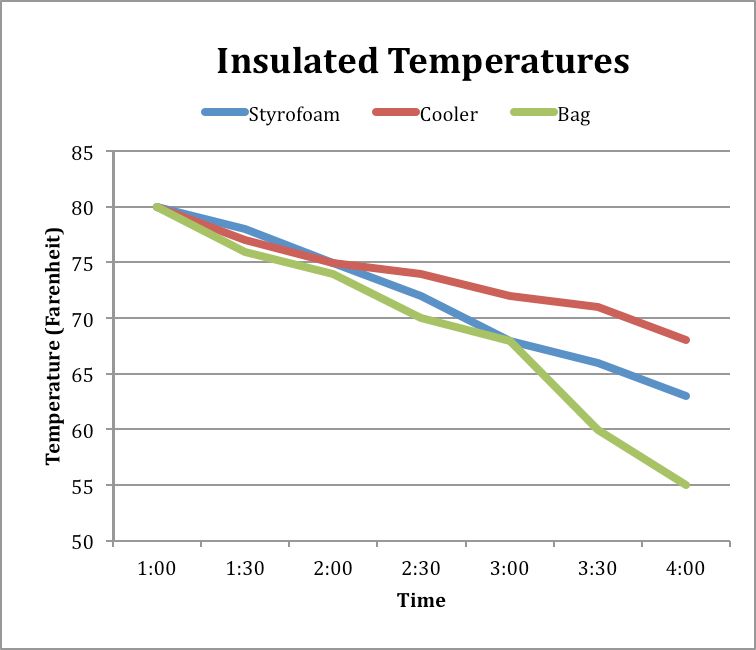
What was the temperature of the liquid in the Styrofoam container at 4:00?
55 degrees
68 degrees
73 degrees
63 degrees
What conclusions can you draw from this graph?
The deer population went down over time.
The deer population went up over time.
The dear population went up quickly, then down, but then stayed the same.
There are less dear because of hunters
Which of the following is an accurate observation that you could make based on what this graph shows.
There was no change to the gummy bear after 24 hours of being submerged in water.
The gummy bear changed the most in length from being submerged in vinegar
The gummy bear that has the greatest mass is the one that was submerged in vinegar.
Gummy bears change color when they are submerged in different liquids.
What is the independent variable of this experiment based on this graph?
the length of the gummy bear before it was submerged
the different types of solutions used to submerge the gummy bears.
the length of the gummy bears after they were submerged in different liquids


Crickets chirp to attract other crickets. The temperatures and rates of their chirping are graphed above. Which statement below is most likely true for the data represented in the graph?
The cooler the temperature, the louder the crickets chirp
The crickets cannot chirp at temperatures lower than 10 degrees C.
The warmer the temperature, the more often crickets chirp.
The temperature and the chirping of crickets are not related.
Hypothesis: If you get at least 6 hours of sleep, you will do better on tests than if you get less sleep.
What is the independent variable in this experiment?
Hypothesis: If you get at least 6 hours of sleep, you will do better on tests than if you get less sleep.
What is the dependent variable in this experiment?
Which one of these does NOT change during the experiment?
Independent
Dependent
Controlled Variables
Control Group

What is the independent variable on this graph?
Year
Number of Visitors
Visitors to a Park
none of these
What is the dependent variable on this graph?
Year
Number of Visitors
none of these

Scenario: You want to test whether water helps to improve plant growth. What is the Independent Variable? (Remember: Independent Variables are what "I"change in the experiment.
The growth of the plant
Amount of Sunlight
Amount of Water

Scenario: You want to test whether water improves the growth of plants. What is the Dependent variable? (Remember: Dependent Variables are what you are measuring or observing.)
The amount of water
The growth of the plant
The amount of sunlight
Scenario: You want to test whether growth hormone helps to create bigger cows. What is the Independent Variable? (Remember: Independent Variables are what "I"change in the experiment.
How much the cows weigh
The amount of growth hormone
How much the cows eat.
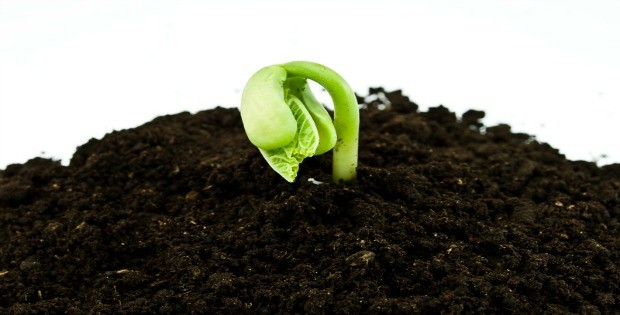
Stephen predicted that seeds would start to grow faster if an electric current traveled through the soil in which they were planted is a(n) example of what step.
question
experiment
form a hypothesis
analyze/conclusions
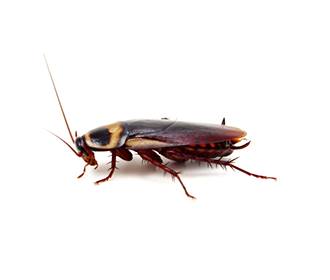
Johnathan’s data showed that household cockroaches moved away from raw cucumber slices is (a)n example of what step?
question
experiment
form a hypothesis
analysis/conclusions
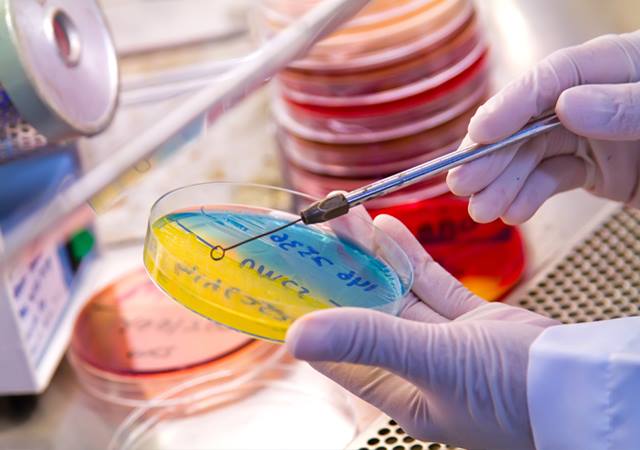
Rene grew bacteria from the mouth on special plates in the laboratory. She placed drops of different types of mouthwash on bacteria on each plate is an example of what step?
question
experiment
form a hypothesis
analysis/conclusion
What step does every scientific experiment begin with?
hypothesis
investigation/observations
experiment
conclusion
Justin wondered if dyes could be taken out of plant leaves, flowers, and stems is a(n) example of what step?
question
experiment
form a hypothesis
analysis/conclusions
Experiment: Sendel wants to see if taking the backroads to work is faster than taking the highway during rush hour.
In Sendel's driving experiment, what is the independent variable?
What time of day she drives
The route she takes to work
The speed at which she drives
The time is takes to get to work
Experiment: Sendel wants to see if taking the backroads to work is faster than taking the highway during rush hour.
In Sendel's driving experiment, what is the control group?
Highway
Backroads
Time she drives to work
Rush hour
Experiment: Sendel wants to see if taking the backroads to work is faster than taking the highway during rush hour.
In Sendel's driving experiment, what is the experimental group?
Highway
Backroads
Time she drives to work
Rush hour

A zoologist wants to know if feeding mice a vitamin supplement will make them grow larger. She feeds 50 mice their regular food, and she feeds 50 other mice food with vitamins. She measures the weight of the mice at the start and end of the experiment.
Dependent Variable
Type of Food
Dependent Variable
Weight of Mouse
A zoologist wants to know if feeding mice a vitamin supplement will make them grow larger. She feeds 50 mice their regular food, and she feeds 50 other mice food with vitamins. She measures the weight of the mice at the start and end of the experiment.
Independent Variable
Type of Food
Independent Variable
Weight of Mouse
Thomas tests different types of liquids to see which will grow his plants the most. He has water, soda, milk, and no liquid at all. What is the control group?
the one with water
the one with soda
the one with milk
the one with no liquid
A scientist hypothesizes that the temperature at which an alligator's egg is incubated will determine whether the alligator will be male or female. The independent variable is

In this experiment the independent variable would be:
The egg.
The volume of water.
The amount of salt.
The float level.

In this experiment the independent variable would be:
The type of fertiliser.
The potting mix used.
The type of plant.
The amount of water given per week.

In this experiment the independent variable would be:
The distance travelled by the model planes.
The force each was thrown with.
The materials each was made with.
The type of model.

Data from an experiment is often organized into tables, charts, and graphs during which step of the scientific method?
Identifying the Question or Problem
Designing the Experiment
Forming the Hypothesis
Analyzing the Results
What type of graph is used to compare categories or groups of data?
Line Graph
Pictograph
Bar Graph
Histogram

Mr. S. sets up an experiment to see how the mass of a ball affects the distance it rolls off a ramp. Identify the independent variable.
distance traveled by the ball
height of the ramp
mass of the ball
weight of the ball

Mr. S. sets up an experiment to see how the mass of a ball affects the distance it rolls off a ramp. Identify the dependent variable.
height of the ramp
distance traveled by the ball
mass of the ball
weight of the ball
One tank of goldfish is fed the normal amount of food once a day. A second tank is fed twice a day. A third tank is fed four times a day during a six week study. The fish’s weight is recorded daily.
(What's the Independent Variable?)
Fish fed normally once a day.
Weight of the fish.
Times fed per day/amount of food.
Type of fish tank.
One tank of goldfish is fed the normal amount of food once a day. A second tank is fed twice a day. A third tank is fed four times a day during a six week study. The fish’s weight is recorded daily.
(What's the Dependent Variable?)
Fish fed normally once a day.
Weight of the fish.
Times fed per day/amount of food.
Type of fish tank.
You decide to clean the bathroom. You notice that the shower is covered in a strange green slime. You try to get rid of this slime by adding lemonade juice. You spray half of the shower with lemonade juice and spray the other half of the shower with water. After 3 days of spraying equal amounts 3 times a day, there is no change in the appearance of the green slime on either side of the shower.
(What's the Control Group?)
Appearance of slime.
The half strayed with water.
Amount of liquid sprayed.
The lemonade juice.
You want to test which size of soccer ball is easiest to juggle with your feet. You test a size 3, size 4, and size 5 ball. You count the seconds the ball stays in the air for each of the trials. You allow yourself to use both of your feet, knees, and head to juggle the ball.
(What's the Dependent Variable?)
There isn't one.
Time ball spends in air.
What you hit it with.
Size of the ball.
You want to test which size of soccer ball is easiest to juggle with your feet. You test a size 3, size 4, and size 5 ball. You count the seconds the ball stays in the air for each of the trials. You allow yourself to use both of your feet, knees, and head to juggle the ball.
(What's the Control Group?)
There isn't one.
Time ball spends in air.
What you hit it with.
Size of the ball.
You decide to clean the bathroom. You notice that the shower is covered in a strange green slime. You try to get rid of this slime by adding lemonade juice. You spray half of the shower with lemonade juice and spray the other half of the shower with water. After 3 days of spraying equal amounts 3 times a day, there is no change in the appearance of the green slime on either side of the shower.
(What's the Independent Variable?)
Appearance of slime.
The half strayed with water.
Amount of liquid sprayed.
The lemonade juice.
Different types of rose bushes are grown in a greenhouse for two months. The number of flowers on each bush is counted at the end of the experiment.
(What’s the Independent Variable?)
The number of flowers.
Different types of rose bushes.
The greenhouse.
There isn't one.
You water three sunflower plants with salt water. Each plant receives a different concentration of salt solutions. A fourth plant receives pure water. After a two- week period, the height is measured.
(What’s the Independent Variable?)
Height of the plant.
Type of plant.
Concentration of salt solution.
Plant getting pure water.
Three redwood trees are kept at different humidity levels inside a greenhouse for 12 weeks. One tree is left outside in normal conditions. The heights of the trees are measured once a week.
(What’s the Independent Variable?)
Humidity level.
Height of each tree.
The tree left outside.
Type of tree.
You water three sunflower plants with salt water. Each plant receives a different concentration of salt solutions. A fourth plant receives pure water. After a two- week period, the height is measured.
(What’s the Dependent Variable?)
Height of the plant.
Type of plant.
Concentration of salt solution.
Plant getting pure water.
Pea plant clones are giving different amounts of water for three-week period. The first pea plant receives 400 milliliters a day. The second pea plant receives 200 milliliters a day. The third pea plant receives 100 milliliters a day. The fourth pea plant does not receive any extra water: the plant only receives natural ways of receiving water. The heights of the pea plants are recorded daily.
(What’s the Independent Variable?)
Height of the plant.
Amount of water.
The plant only getting water naturally.
Type of plant.
Pea plant clones are giving different amounts of water for three-week period. The first pea plant receives 400 milliliters a day. The second pea plant receives 200 milliliters a day. The third pea plant receives 100 milliliters a day. The fourth pea plant does not receive any extra water: the plant only receives natural ways of receiving water. The heights of the pea plants are recorded daily.
(What’s the Control Group?)
Height of the plant.
Amount of water.
The plant only getting water naturally.
Type of plant.
Three redwood trees are kept at different humidity levels inside a greenhouse for 12 weeks. One tree is left outside in normal conditions. The heights of the trees are measured once a week.
(What’s the Dependent Variable?)
Humidity level.
Height of each tree.
The tree left outside.
Type of tree.
Different types of rose bushes are grown in a greenhouse for two months. The number of flowers on each bush is counted at the end of the experiment.
(What’s the Dependent Variable?)
The number of flowers.
Different types of rose bushes.
The greenhouse.
There isn't one.
You water three sunflower plants with salt water. Each plant receives a different concentration of salt solutions. A fourth plant receives pure water. After a two- week period, the height is measured.
(What’s the Control Group?)
Height of the plant.
Type of plant.
Concentration of salt solution.
Plant getting pure water.
Three redwood trees are kept at different humidity levels inside a greenhouse for 12 weeks. One tree is left outside in normal conditions. The heights of the trees are measured once a week.
(What’s the Control Group?)
Humidity level.
Height of each tree.
The tree left outside.
Type of tree.
Pea plant clones are giving different amounts of water for three-week period. The first pea plant receives 400 milliliters a day. The second pea plant receives 200 milliliters a day. The third pea plant receives 100 milliliters a day. The fourth pea plant does not receive any extra water: the plant only receives natural ways of receiving water. The heights of the pea plants are recorded daily.
(What’s the Dependent Variable?)
Height of the plant.
Amount of water.
The plant only getting water naturally.
Type of plant.
You decide to clean the bathroom. You notice that the shower is covered in a strange green slime. You try to get rid of this slime by adding lemonade juice. You spray half of the shower with lemonade juice and spray the other half of the shower with water. After 3 days of spraying equal amounts 3 times a day, there is no change in the appearance of the green slime on either side of the shower.
(What's the Dependent Variable?)
Appearance of slime.
The half strayed with water.
Amount of liquid sprayed.
The lemonade juice.
One tank of goldfish is fed the normal amount of food once a day. A second tank is fed twice a day. A third tank is fed four times a day during a six week study. The fish’s weight is recorded daily.
(What's the Control Group?)
Fish fed normally once a day.
Weight of the fish.
Times fed per day/amount of food.
Type of fish tank.
You want to test which size of soccer ball is easiest to juggle with your feet. You test a size 3, size 4, and size 5 ball. You count the seconds the ball stays in the air for each of the trials. You allow yourself to use both of your feet, knees, and head to juggle the ball.
(What's the Independent Variable?)
There isn't one.
Time ball spends in air.
What you hit it with.
Size of the ball.
The things that are kept the same to ensure the results are due to the experiment are called..
Control Group
Constants
Independent Variable
Dependent Variable
The variable that is changed on purpose is..
Control Group
Constants
Independent Variable
Dependent Variable
The variable that is measured/affected by another variable is..
Control Group
Constants
Independent Variable
Dependent Variable
The part of the experiment that is kept the same so we can compare our results to see if there is a change..
Control Group
Constants
Independent Variable
Dependent Variable

3 students are measuring the length of Miss Nelson's desk. The real desk length is 3 meters.
How can Student A's measurements be classified?
accurate only
precise only
accurate and precise
neither accurate or precise
3 students are measuring the length of Miss Nelson's desk. The real desk length is 3 meters.
How can Student C's measurements be classified?
accurate only
precise only
accurate and precise
neither accurate or precise



A
B
C
D
In an experiment to determine the effects of listening to loud music on test scores, what would the x-axis label be?
Type of music
Test score
Volume of music
Grade in class

Describe the trend shown in the graph.
As the volume decreases, the mass stays the same.
As the mass decreases, the volume increases.
As the volume increases, the mass increases.
As the mass increases, the volume stays the same.

The graph shows the number of inches a plant grew each week.
Between which 2 weeks did the plant grow the MOST?
Week 1 and Week 2
Week 2 and Week 3
Week 3 and Week 4
Week 4 and Week 5


Which of the following would be a reasonable claim for this graph?
As the elevation increases, the temperature decreases.
As the elevation increases, the temperature increases.
As the elevation increases, the temperature is unaffected.
The air is thinner at higher elevations due to the decreased force of gravity so it cannot absorb as much heat and the temp is lower.

What kind of correlation does this graph show?
Negative
Positive
None

Which 2 data points would provide the BEST evidence to support the claim "the more books someone owns the more hours they will spend reading"?
When 1 book is owned, people spend 1 hour reading.
When 3 books are owned, people spend 3 hours reading.
When 7 books are owned, people spend 7 hours reading.
When 10 books are owned, people spend 10 hours reading.

What kind of correlation is demonstrated on this graph between ice cream consumed and clothing worn?
Positive
Negative
None

Which 2 graphs support the claim "As the temperature increases, more KNO3 will dissolve"?
A
B
C
D

What kind of correlation is demonstrated on this graph between Shoe side and test score?
Positive
Negative
None

What is the best kind of graph to represent this data?
Line graph
Table graph
Bar graph
Pie chart

What reasoning could be used to support the claim "As practice time increases, strikes also increase"?
When you practice more you get more strikeouts.
The graph shows it.
More practice increases muscle memory, strength and coordination which are skills necessary to consistently hit a strike.
You get more strikeouts with more practice.
What would be the best CLAIM statement for this graph?
Water closer to the surface is able to absorb more heat energy from the sun so it is warmer than the deeper water, which cannot be reached by the sunlight.
As the water depth increases, the temperature decreases.
As water depth decreases, the temperature increases.
See the graph
What kind or corollary relationship does this chart demonstrate between water depth and temperature?
Positive
Negative
None

What kind of correlation appears to exist between the size of the television and amount of time spent watching it?
Positive
Negative
None
What reasoning could be provided to support the the claim "The size of the television has no correlation to the amount of time a person watches it"?
People with bigger TVs always watch more TV.
The size of the TV is unrelated to how much TV people watch.
See the graph.
The size of television probably has more to do with how much money people make and are wiling to spend on the TV or the size of their room, not how much actually watch it.

What kind of correlation appears to exist between height and weight?
Positive
Negative
None

What 2 pieces of evidence could be used to support the claim "As height increases so does weight"?
A 37" kid is 70lbs
See the graph
As people grow they get more cells which weigh more so their overall weight would increase as well.
A 55" kid is 150lbs

What would be the best kind of graph to represent this data?
Pie chart
Line Graph
Table Graph
Bar Graph
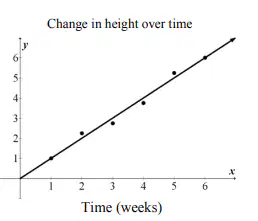
Alexander was studying the effect of playing rock music on plant growth. One of the plants was exposed to rock music for 24 hours a day for a period of 6 weeks. Data on the growth of the plant was collected at the end of each week and plotted in a graph. Based on the data, which would be the MOST reasonable measurement at the end of an 8-week period?
2 dm
6 dm
8 dm
16 dm

In this experiment, the independent variable they are testing is_____
(Important: Refer to the image and read the experiment description)
The type of solution the egg is placed in
The amount of time they were in the solution
Change in the mass of eggs
The ending mass of the eggs
This group also recorded a dependent variable, which is represented by_________
(Important: Refer to the image and read the experiment description)
The change in the mass of the eggs
The ending mass of the eggs
The amount of time the were in the solution
The type of solution the egg is placed in
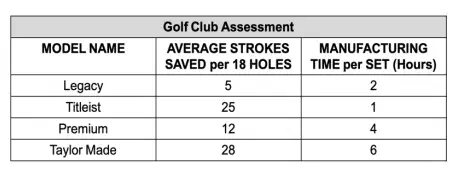
A golf club company has four models of golf clubs. Average strokes saved per 18 holes is a positive indicator of quality (the more strokes saved, the better the golf clubs). The manufacturing time per set is a measure of how long it takes to manufacture one set of clubs. If the company wishes to produce a lot of golf clubs quickly, which set would be the best choice to meet their criteria, based on the data table?
(Hint: Refer to image 1)
Legacy
Titleist
Premium
Taylor Made
Based on the data this group gathered, the most appropriate hypothesis would be_________
(Important: Refer to the image and read the experiment description)
“If an egg is placed in a pure water solution, then the egg will gain weight"
“If three eggs are each placed in three different solutions, then the egg in distilled water will lose weight.”
“If an egg is placed in vinegar overnight, then its shell will dissolve.”
“If an egg is placed in corn syrup, then it will gain weight.”
In a hypothesis the __________________ variable is what is being tested, while the _________________ variable is the one being measured in response.
control; dependent
independent; control
dependent; independent
independent; dependent

Eight college students recorded how many hours they exercised every week. Then they measured their pulse (heartbeats per minute) while they were resting. What does the graph show?
The more you exercise, the higher your resting pulse.
The more you exercise, the lower your resting pulse.
Exercise has no effect on your resting pulse.
All of the college students had the same resting pulse.

