
 Worksheets
Supply and Demand Test Review
Total questions: 45
Worksheet time: 23mins
Name
Class
Date
1.
What happens to the market for oranges when a cold snap hits Florida?
a)
supply goes down and prices go up.
b)
supply goes down and prices go down.
c)
supply goes down and prices stay the same.
d)
They give them out for free in the name of philanthropy.
2.
People decide to escape cold weather in New York and travel to the Caribbean. How would this affect the price of hotel rooms in the Caribbean?
a)
Cold weather in New York drives the demand and thus the price down in the Caribbean.
b)
Cold weather in New York does not affect the price of a hotel room in the Caribbean.
c)
Cold weather in New York drives the demand up and the price increases for hotel rooms in the Caribbean.
d)
It doesn't matter because no one wants to visit the Caribbean anyway.
3.
When a war breaks out in the Middle East and the global supply of oil decreases, the price of gasoline in the United States
a)
goes up.
b)
goes down.
c)
stays the same.
d)
encourages people to buy cars that consume a great deal of gas.
4.

Supply and demand ultimately determine the ______ equilibrium and _______ equilibrium of a product.
a)
price/quantity
b)
imports/exports
c)
supply/demand
d)
market/command
e)
5.

Imagine the market for pizza. If the cost of wheat, used to make dough, increases then which graph would most likely occur?
a)
Graph A
b)
Graph B
c)
Graph C
d)
Graph D
6.

An increase in labor costs (minimum wage goes from $7.25 to $100 per hour) would have a negative effect on the business. Which of the following graphs show an increase in labor costs leading to a decrease in the ability to supply?
a)
Graph A
b)
Graph B
c)
Graph C
d)
Graph D
7.
The "stuff" that sellers are willing and able to sell is known as
a)
supply
b)
law of supply
c)
supply schedule
d)
supply curve
8.

Based on the law of supply, when consumers are willing to pay high prices for products, the quantity supplied
a)
increases.
b)
decreases.
c)
diminishes.
d)
is unchanged.
9.

A table that shows the relationship between the price of a good and how much a supplier is willing to sell is the
a)
supply schedule
b)
demand curve
c)
demand schedule
d)
market schedule
10.

Unlike the demand curve, the supply curve slopes
a)
upward.
b)
downward.
c)
there is no slope.
d)
sideways
11.

All of the following could potentially shift the supply curve EXCEPT
a)
number of buyers
b)
input costs
c)
technology
d)
future expectations of prices
e)
number of sellers
12.

The point where supply and demand intersect is called equilibrium, or the
a)
market clearing price
b)
supply
c)
demand
d)
opportunity cost
13.

At the equilibrium, the quantity of products buyers are willing and able to buy ________ balances the quantity that sellers are willing and able to sell.
a)
exactly
b)
inexactly
c)
indifferently
d)
sometimes
14.
If prices are above the equilibrium point (too high) then the supplier will end up with a
a)
surplus
b)
shortage
15.
If the price of the good is too low, then the supplier will end up with a
a)
shortage
b)
surplus
16.

In most market based economies, surpluses and shortages are only temporary because
a)
costs of inputs prevent low prices
b)
neither makes sense for the buyer and seller
c)
production possibilities.
d)
comparative advantage.
17.

A situation where there is more demand than supply is referred to as
a)
excess demand
b)
excess supply
c)
surplus
d)
abundance
18.

A situation where there is more QS than QD is referred to as
a)
excess supply
b)
excess demand
c)
excess shortage
d)
diminishing returns
19.

Supply and price have a direct or ____ relationship.
a)
positive
b)
negative
c)
downward
d)
decreasing
20.

A shift to the left in the supply curve indicates a ___ in supply while a shift to the right indicates a ____ in supply.
a)
decrease/increase
b)
increase/decrease
21.

Advances in technology would most likely be represented by which graph?
a)
Graph A
b)
Graph B
c)
Graph C
d)
Graph D
22.

Based on the graph, the equilibrium price is
a)
5
b)
10
c)
15
d)
20
e)
25
23.

Based on the graph, the equilibrium quantity is
a)
200
b)
400
c)
600
d)
800
e)
1000
24.

Based on the figure, if the price was set at $7, there would be a
a)
shortage
b)
surplus
25.

If the demand for a product increases what will happen to the market price and quantity?
a)
rise
b)
fall
c)
stay the same
d)
indeterminant
26.

The iPhone XS sold out in the first day of its release. Which graph would show this increase in the popularity of the iPhone?
a)
Graph A
b)
Graph B
c)
Graph C
d)
Graph D
27.

Which of the following would lead to an INCREASE in the demand (D not QD) for golf balls?
a)
An increase in the popularity of Bryson DeChambeau (pro golfer)
b)
An increase in the price of golf clubs.
c)
An increase in average household income when golf balls are a normal good.
d)
none of the above
28.

The cost of producing the glass, computer chips, plastics and other parts to the iPhone increases. Which graph represents this scenario?
a)
Graph A
b)
Graph B
c)
Graph C
d)
Graph D
29.
If corn shortages cause corn to go up in price, then any product that uses corn as an input will...
a)
increase in price
b)
decrease in price
30.

Based on the figure, if the price was set at $25 there would be a
a)
shortage of 300
b)
surplus of 400
c)
shortage of 800
d)
surplus of 100
31.

Based on the graph, if the price was set at $5, there would be a shortage of
a)
60
b)
10
c)
20
d)
30
e)
40
32.

Based on the graph, when demand shifts to the right, the equilibrium price
a)
increases
b)
decreases
c)
stays the same
33.

Based on the graph, when demand shifts to the right, the quantity supplied
a)
increases (movement along the Supply curve)
b)
decreases (movement along the Supply curve)
c)
stays the same
34.

Based on the graph and the supply shift, price ____ and quantity demanded ____.
a)
increases/increases
b)
decreases/increases
c)
decreases/decreases
d)
increases/decreases
35.

Based on the graph, the dotted lines meet at the
a)
market clearing price (equilibrium)
b)
disequilibrium
c)
surplus
d)
shortage
36.

Based on the graph the blue line is the ____ curve and the red is the ___ curve.
a)
supply/demand
b)
demand/supply
c)
supply/supply
d)
demand/demand
37.

In the graph, the change in supply has brought prices
a)
down
b)
up
c)
no change
d)
around
38.

The graph below depicts the market for vinyl albums. Which of the following is true at a price of $30?
a)
there is a shortage of 28 albums
b)
there is a shortage of 40 albums
c)
there is a surplus of 40 albums
d)
there is a surplus of 21 albums
39.

Refer to the diagram. Assume that shoes and sandals are substitutes. Which of the following could have caused this demand curve to shift in the shoe market?
a)
summer hits and people begin wearing sandals.
b)
the price of sandals, a substitute good increased
c)
consumer income increased
d)
technology increases in the shoe market
40.

Amazon recently implemented drone delivery, a technological innovation, which allows them to expedite deliveries on all small packaged goods. Which of the following graphs would represent this improved technology?
a)
Graph A
b)
Graph B
c)
Graph C
d)
Graph D
41.
The original Nokia was a popular phone. As a result of the increase in the popularity of smartphones what would happen to the price of the original basic Nokia
a)
fall
b)
increase
c)
stay the same
42.
Currently, there is a huge surplus of unsold houses on the market. How will the surplus of unsold houses affect their price?
a)
inflated the prices
b)
brought the price of the homes down
c)
increased the value of the unsold homes
d)
had no affect
43.
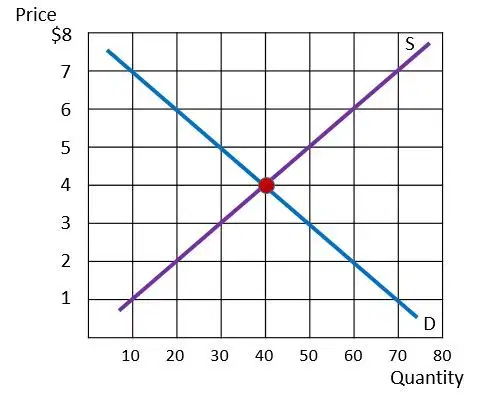
According to the graph, what is the equilibrium price?
a)
$4.00
b)
$3.00
c)
$2.00
d)
$1.00
e)
$.50
44.

According to the graph, what is the quantity equilibrium?
a)
40
b)
30
c)
20
d)
10
45.

Another name for equilibrium is the
a)
equator
b)
equestrian
c)
market clearing price
d)
market nearing price
100 %

