
NEW
Font size
 Worksheets
Unit 2 Carrying Capacity & Nutrient Cycles
Total questions: 40
Worksheet time: 1hrs 23mins
________ is the process where liquid water turns into water vapor due to heat from the sun.
Condensation
Transpiration
Sublimation
Evaporation
_________ is water released from clouds in the form of rain, freezing rain, sleet, snow, or hail.
Condensation
Precipitation
Evaporation
Sublimation
The water on our planet is the same water that was here millions of years ago. However, it is continuously moving and being recycled through the water cycle.
True
False
_________ is the process of water vapor turning back into a liquid upon cooling.
Condensation
Runoff
Transpiration
Sublimation
The evaporation of water out of the leaves of plants happens during which step?
Condensation
Evaporation
Transpiration
Runoff


The image shows various stages in the water cycle. During which stage does water flow back towards the sea as runoff?
W
X
Y
Z
If the plant population decreased, the amount of carbon in the atmosphere would _________.
Stay the same
Increase
Decrease

When humans burn fossil fuels, most of the carbon quickly enters the as carbon dioxide.
Water
Atmosphere
Sun
Air

Identify the cycle illustrated in the diagram.
Nitrogen Cycle
Water Cycle
Phosphorus Cycle
Carbon Cycle
Large areas of land are being developed. In the process, thousands of trees are being removed and burned.
Yes or No: When forest are cleared or burnt, stored carbon dioxide is released into the atmosphere and this would affect the carbon cycle.
YES
NO
Which of the following processes in the nitrogen cycle is where decomposers break down animal and plant proteins (from dead organisms) and waste to release energy, releasing a form of ammonium into the soil.
NITROGEN-FIXATION
DECOMPOSITION
NITRIFICATION
DINITRICATION
Humans add nitrogen to the nitrogen cycle by -
burning fossil fuels
cellular respiration
using fertilizers
What is the most abundant gas in the atmosphere?
Carbon dioxide
Oxygen
Nitrogen
How do animals get the nitrogen they need?
from the air they breathe
from the water they drink
from the food they eat
from the Sun

Organisms that need nitrogen to survive.
only plants
only animals
only bacteria
all living things

What is the main reservoir of nitrogen?
Water bodies
Plants
Atmosphere
Soil

What type of growth is demonstrated in the graph?
Exponential
Carrying capacity
Linear
Negative
Leveling off of the population after the maximum number the environment can support has been reached.
Exponential
Carrying capacity
Linear
Negative
Which of the following would likely be a limiting factor to a population?
Abundance of food
Living near a water source
Presence of a natural predator
Multiple sources for shelter
When rabbits were introduced to Australia, they began to breed exponentially. However, over time their population has begun to decrease due to a limiting factor.
What is most likely the limiting factor in this situation?
Abundant space to breed and live
No available predator in the area
Rabbits choosing not to mate to conserve space
Lack of available food
Which of the following demonstrates population growth when there is limited available water in an area?


Habitat availability increases for a population. How would the carrying capacity of the prey change?
The carrying capacity would increase as more resources become available.
Carrying capacity occurs independent of factors in the environment.
The carrying capacity would decrease as more resources became available.
The carrying capacity is set in an environment and cannot change.

What happens if a population grows past its carrying capacity?
The population keeps growing
The population starts to die off
The entire species will go extinct
The carrying capacity just increases
This may cause a population to increase
increase of food supply
removal of predators
removal of disease
all of these

Something that regulates the size of a population is called...
a limiting measure
a limiting factor
carrying capacity
biodiversity

What is the carrying capacity of the graph?
1000
8000
800
1200
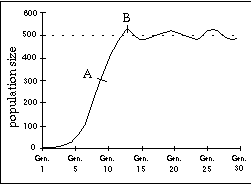
What is the carrying capacity of the graph?
around 500
around 530
less than 300
around 700

If a disease destroying barley plants in a field swept through an ecosystem, what would happen to the barley-eating bird population in the the field ?
A scientist was studying a population of fish in a pond over a period of 10 years. He observed that the population increased each year for 3 years, and then remained nearly constant for the rest of the study. The best explanation for this observation is that the population had
stopped reproducing
reached carrying capacity
mutated into a different species
run out of food and all died


