
Font size
 Worksheets
Data and Statistics Review
Total questions: 88
Worksheet time: 5hrs 42mins
Is the following question statistical or non statistical?
How many cars are in our parking lot?
Statsitical
Non Statistical
Is the following question statistical or non statistical?
What pets do students in our class have?
Statistical
Non statistical
Is the following question statistical or non statistical?
How many siblings do each student have?
Statistical
Non Statistical
How many lanterns are hanging in our classroom
Is the following question statistical or non statistical?
How many students in our class like the color blue?
Statistical
Non Statistical
Is the following question statistical or non statistical?
On average, how many pencils does each classroom go through daily?
Statistical
Non Statistical
On average, how many siblings does each classmate have?
Statistical Q
Non Statistical Q
Choose the statistical question:
How many sixth graders ate breakfast on Monday?
How many sixth graders eat breakfast each school day?
Choose the statistical question:
What is the favorite pet of sixth graders at YMS?
How many sixth graders own a dog?
Choose the statistical question:
How many cousins does each sixth grader at YMS have?
How many siblings do you have?
Choose the statistical question:
What time did Scott wake up this morning?
What time do sixth graders wake up each morning during the school week?
Which of the following are reasons to ask statistical questions?
Data can help identify problems to solve.
Data can help businesses make better decisions.
Data can help people make informed choices.
Statistical questions have _____ possible answers.
zero
one
only two
two or more
How many cats does Amy own?
statistical
non-statistical
Change to a statistical question: How many sixth graders like pizza?
How many sixth graders ate pizza last night?
How many times per week do sixth graders eat pizza?
How much does you backpack weigh? What kind of data would the results from this question produce?
Categorical Data
Numerical Data
What is your favorite band? What kind of data would the results from this question produce?
Categorical Data
Numerical Data

12,10,10,10,13,12,11,13,10
4 7 5 9 8 6 7 7 8 5 6 9 8 5 8 7 4 7 3 6 8 9 7 6 9
What is the mode?
5,11,2,12,4,2
4,2,7,4,3
3, 5, 7, 9, 11, 8, 3
1,0,1,5,6,3,4
A graph is ______________when most of the data points are clustered near high values.
skewed left
skewed right
symmetrical
peak
An outlier is a data point _____________from the other data points. It doesn't quite fit the rest of the data points.
closes to
far away
below
above




What range has the most values?
50-55
55-60
70-75
100


Is this a statistical question: How many players are on the Springfield football team?
Yes
No
Is this a statistical question: How many emails do you send each each day?
Yes
No
Brandon mows yards each week to make some money. If he mows three yards and one yard takes him 1 hour, one yard takes him 1 hour and a half and the last yard takes him 2 hours to mow, what is the average time per yard (use the mean)?
1.25 hours
1.50 hours
1.75 hours
2 hours
The temperature in Springfield on this date in the last ten years were: 68, 68, 69, 70, 72, 70, 68, 75, 55, 67. What is the average temperature on this date over the last ten years? (Round to nearest whole number) Use the Mean.
60
61
68
69
Jessica has five grades from assessments and quizzes. They are all weighted equally. If her grades are 50, 70, 88, 70, and 88, what is her current average grade?
71
72
73
74
Christian has six grades from tests and IXL. They are all weighted equally. If Christian's grades are 100, 96, 96, 88, 70, and 100, what is the current average grade? (Round to the nearest whole number)
90
91
92
93
Find the median for the set of numbers:
17, 24, 8, 19, 6, 34, 10, 28, 48, 12
17
19
18
20
Find the median for the set of numbers:
85, 42, 64, 71, 39, 56, 26
71
42
56
60
Find the median for the set of numbers:
23, 37, 11, 58, 13, 45
30
23
37
28
The average temperatures across Washington, Texas, Oklahoma, New York, Missouri, Hawaii and Michigan are 48°F, 65°F, 60°F, 45°F, 54°F, 64°F, 70°F, and 45°F respectively. Find the median.
(a)

12,10,10,10,13,12,11,13,10
2, 57, 38, 42, 6
12, 5, 9, 18, 22, 25, 5
8, 14, 32, 6, 15
5,11,2,12,4,2
4,2,7,4,3
6, 12, 16, 11, 8, 4, 1, 11, 4
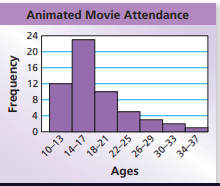
What is the shape of the data?
symmetrical
skewed left
skewed right
bell curve



What is the shape of the distribution?
Skewed Left
Skewed Right
Symmetric
Uniform

What is the shape of the data?
symmetrical
skewed left
skewed right
bell curve

What is shape of the data?
symmetrical
skewed left
skewed right
bell curve

Which statement best describes the graph?
The data is skewed left.
The data is symmetrical.
There is a peak between 10 and 14 hours.
There is a cluster between 5 and 9

What is the shape of the distribution?
Skewed Left
Skewed Right
Symmetric
Uniform

The data for the latest test is shown in this graph. Select the true statement.
The data has a gap a 74 and 76
The data is symmetrical
The data is skewed right
The data is skewed left

This is the data gathered from Non-Fiction books in our media center. Select the true statement about the distribution.
The data is symmetrical.
The data is skewed left.
The data is skewed right.
The data is bell-shaped.

How would you describe this data?
Skewed Left
Skewed Right
Symmetrical
A total amount
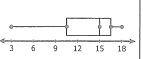
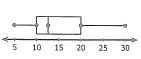
What is the shape of the data?
Skewed Left
Skewed Right
What is shape of the data?
Symmetrical
Skewed Left
Skewed Right
Asymmetrical

Which statement is best supported by this graph?
The peak of the data occurs within the category "20-29" text messages, and the shape of the data is asymmetrical.
The peak of the data occurs within the category "30-39" text messages, and the shape of the data is asymmetrical.
The peak of the data occurs within the category "30-39" text messages, and the shape of the data is symmetrical.
The peak of the data occurs within the category "20-29" text messages, and the shape of the data is symmetrical.






