Wayground logo

Free Printable Worksheets

Font size

S
M
L
XL
Worksheets

Chapter 8 Human Population Review

Total questions: 50

Worksheet time: 29mins

Name
Class
Date
1.

The size of the human population began to increase exponentially after the

a)

bubonic plague

b)

development of plowing and irrigation

c)

Industrial Revolution

d)

development of the first cities.

2.

Which of the following is NOT a potential limiting factor of human population growth?

famine medicine war disease

a)

disease

b)

war

c)

medicine

d)

famine

3.

After the demographic transition is complete, a population

grows rapidly. grows slowly. begins a period of rapid decline. stays about the same size as time passes.

a)

grows rapidly

b)

grows slowly

c)

begins a period of rapid decline

d)

stays about the same size as time passes.

4.

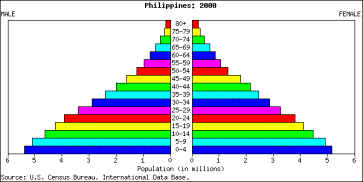
Name the type of pyramid in the picture.

a)

slow growth

b)

rapid growth

c)

zero growth

d)

negative growth

5.
Why has the world population dramatically increased?
a)
Better medicine
b)
Better sanitation
c)
Better technology
d)
All of the above
6.
Number of Individuals per unit area
a)
density-dependent factors
b)
carrying capacity
c)
renewable resource
d)
population density
7.
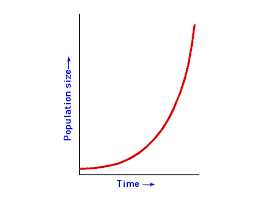
What type of growth is shown in the diagram?
a)
exponential growth
b)
logistic growth 
c)
predator-prey cycle
d)
boom-bust curve
8.
Demography is the scientific study of
a)
parasitism and disease.
b)
modernized countries.
c)
human populations.
d)
none of these
9.
Demographic transition is change from high birthrates and high death rates to
a)
exponential growth.
b)
low birthrates and low death rates.
c)
low birthrates and high death rates.
d)
indefinite growth.
10.
In Rwanda, there are more young children than teenagers, and more teenagers than adults. This age structure indicates a population that
a)
has stopped growing.
b)
will double in 30 years.
c)
has a steady growth rate.
d)
will decrease in 30 years.
11.
Most of the worldwide human population is growing exponentially because
a)
human populations have not reached their exponential curve.
b)
most countries have not yet completed the demographic transition.
c)
human populations do not conform to the logistic model.
d)
the food supply is limitless.
12.
What three factors can affect ANY population's growth rate?
a)
Birthrate, death rate, migration
b)
disease, predation, migration
c)
medicine, agriculture, industry
d)
life expectancy, sanitation, vaccines
13.
Which of the following would most likely occur if a population exceeded the carry capacity of the environment?
a)
The birth rate would likely increase.
b)
Birth rate would be equal to the death rate.
c)
The death rate would increase.
d)
Immigration would increase.
14.
The percentages of individuals found at different age levels make up the ______ of the population.
a)
carrying capacity
b)
age structure
c)
survivorship
d)
birthrate
15.

What does the term carrying capacity describe?

a)

The maximum number of birth rates for a population.

b)

The ability of a population to accept new immigrants.

c)

The ratio of birth rates to death rates in a population.

d)

The population size that the environment can sustain.

16.
What is the carrying capacity of the following graph?
a)
1000
b)
8000
c)
800
d)
600
17.
If the number of births in a population is the same as the number of deaths in a population, what will happen to the growth of the population?
a)
It will increase.
b)
It will decrease.
c)
It will stay the same.
d)
It will fluctuate.
18.
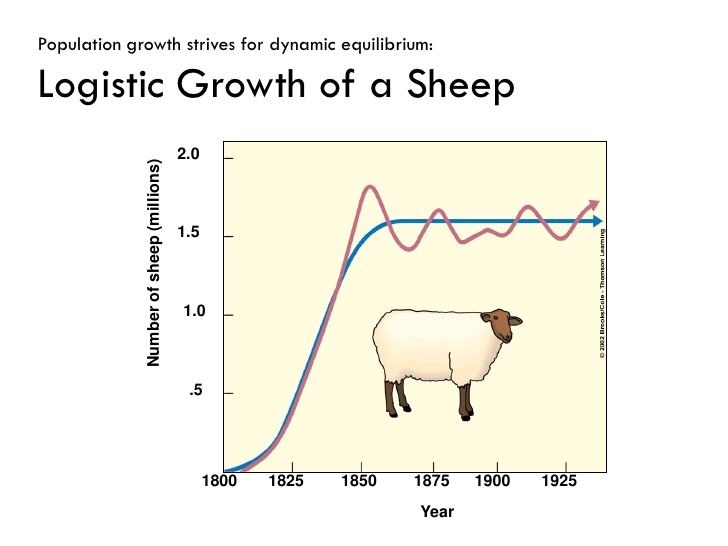
What is the carrying capacity for this sheep population?
a)
1.8 million
b)
1.25 million
c)
1.6 million
d)
1.o million
19.
If the number of births is greater than the number of deaths in a population, what will happen to the growth of the population?
a)
It will increase.
b)
It will decrease.
c)
It will stay the same.
d)
It will fluctuate.
20.
When a population grows past the ecosystem's carrying capacity, what happens to the population?
a)
Continues to grow
b)
The population starts to die off to return to carrying capcity
c)
The population will go extinct due to lack of resources
d)
The population grows then finds a new carrying capacity
21.
According to the population pyramid of this country, its population is most likely...
a)
growing slowly.
b)
growing rapidly.
c)
decreasing.
d)
not changing.
22.
Which has NOT been a major cause of the population explosion?
a)
modern preventive medicine
b)
increase in life expectancy
c)
improved sanitation
d)
increase in birth rates
23.
Which of the following is likely to be affected by a population of 7 billion?
a)
amount of land for agriculture
b)
amount of clean water
c)
number of people who are unemployed
d)
all of the above
24.
Which region of the world has the fastest growing population?
a)
Southeast Asia
b)
Eastern Europe
c)
Sub-Saharan Africa
d)
Latin America
25.
The number of live births per 1000 people is called the...
a)
growth rate.
b)
infant rate.
c)
baby total.
d)
birth rate.
26.
All of the following are demographic figures used in determining the total population of a country EXCEPT...
a)
immigration.
b)
birth rate.
c)
death rate.
d)
marriage rate.
27.
Deserts are usually....
a)
densely populated.
b)
sparsely populated.
c)
evenly populated.
d)
None of the above
28.
If a country has a death rate of 30 and a birth rate of 45 the natural rate of increase would show the population is ______.
a)
Increasing
b)
Decreasing
c)
Staying the same
d)
Fluctuating too much
29.
The maximum population size of a species that the environment can sustain indefinitely, given the food, habitat, water and other necessities available in the environment.
a)
sparse population
b)
environmental
c)
carrying capacity
d)
dense population
30.
The average number of people living in a square kilometer is called...
a)
urbanization. 
b)
internal migration. 
c)
population density. 
d)
pull factors. 
31.
One reason for a rapid population growth is...
a)
an increase in pull factors.
b)
declining death rates. 
c)
a sparse population density. 
d)
internal migration.
32.
What is a population pyramid?
a)
A type of graph showing the number of males and females in different age groups.
b)
A type of graph showing the number of males in different age groups.
c)
A type of graph showing the number of females  in different age groups.
d)
A type of graph showing the number of males and females in only one age group.
33.

What is one major cause of population growth?

a)

better transportation

b)

a falling death rate

c)

food shortages

d)

poor health care

34.

Rapid population growth can harm the environment because of the _____.

a)

surplus of jobs

b)

use of wind, solar and geothermal energy

c)

increase in poverty

d)

increased demand for resources

35.

For a population’s growth rate to be zero

a)

more deaths than births must occur

b)

more births than deaths must occur

c)

no births can occur

d)

the average number of births and deaths must be the same

36.

Identify Stable / Zero Population growth

a)

A

b)

B

c)

C

d)

None

37.

Identify Negative Population growth

a)

A

b)

B

c)

C

d)

None

38.

Identify Rapid Population growth

a)

A

b)

B

c)

C

d)

None

39.

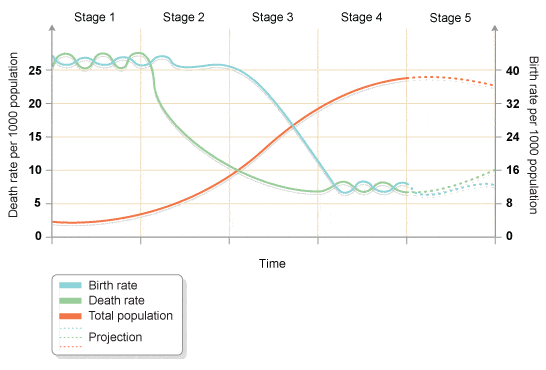
small population size, low growth rate (stage 1)

a)

preindustrial

b)

postindustrial

c)

transitional

d)

industrial

40.

increasing population size, very high growth rate (stage 2)

a)

preindustrial

b)

postindustrial

c)

transitional

d)

industrial

41.

large population size, low growth rate (stage 3)

a)

preindustrial

b)

postindustrial

c)

transitional

d)

industrial

42.

decreasing population size, zero or negative growth rate (stage 4)

a)

preindustrial

b)

postindustrial

c)

transitional

d)

industrial

43.

Professionals who study and make predictions about human populations are called

a)

stenographer

b)

demographer

c)

geologist

d)

populist

44.

Educating women worldwide has lowered birthrates partly because

a)

educated women bear many children to ensure some survive

b)

educated women may learn family-planning techniques

c)

educated women contribute less to their family income

d)

all of these answers

45.
Little medical care, no birth control, children seen as an asset, plagues and famines are characteristics of stage
a)
1
b)
2
c)
3
d)
4
46.
Birthrate remains high, death rate begins to fall, total population increasing
a)
Stage 1 Demographic Transition
b)
Stage 2 Demographic Transition
c)
Stage 3 Demographic Transition
d)
Stage 4 Demographic Transition
47.

A characteristic of stage Three of the Demographic Transition Model shows?

a)

High birth and death rates

b)

Low death and high birth rates

c)

Declining birth and death rates

d)

High death and low birth rates

48.

A characteristic of stage one of the Demographic Transition Model shows

a)

High birth and death rates

b)

Low death and high birth rates

c)

Low birth and death rates

d)

High death and low birth rates

49.

A characteristic of stage four of the Demographic Transition Model shows

a)

High birth and death rates

b)

Low death and high birth rates

c)

Low birth and death rates

d)

High death and low birth rates

50.

On the Demographic Transition Model, which stage(s) is/are characterized by HIGH death rates, High BIRTH RATES, but LOW populations.

a)

Stage 1

b)

Stage 2

c)

Stage 3

d)

Stages 4 and 5