
 Worksheets
Environmental Science Final Exam REVIEW
Total questions: 30
Worksheet time: 27mins
The birds, insects, plants, fungi, and other organisms that reside in a nearby wetland.
Population
Organism
Molecules
Community
A(n) _________ species is one that moves into an ecosystem as a result of human intervention.
endemic
endangered
invasive
Which of the following is an example of secondary succession?
growth of plants after a forest is destroyed by fire
breaking down of bare rock by fungi and mosses
appearance of weeds in cracks in a concrete surface

Pictures Q, R, S, and T, in Figure 2.6, show the levels of organization of living things in a desert ecosystem. Which of the following shows the correct order of these pictures from the highest level to the lowest level of organization?
T-S-Q-R
R—Q—T-S
S-T-R—Q
Q-R-T-S

Which of the following best describes how the chemical energy travels up the food pyramid?
Chemical energy is used by each of the organisms in the food pyramid, resulting in less energy as it moves up the pyramid.
Chemical energy is used by producers but created by consumers, resulting in fluctuations in the amounts of energy throughout the food pyramid.
Chemical energy is not needed by the organisms in the food pyramid, resulting in equal amounts of energy throughout the food pyramid.
Chemical energy is made by each of the organisms in the food pyramid, resulting in more energy as it moves up the pyramid.
In an African savanna, there are communities of giraffe, zebra, lion and acacia trees. What factors would you need to include to accurately describe the savanna's ecosystem?
remove the zebra and lion
include the temperature, intensity of light and soil pH
include ants and grasses
remove the acacia trees

The photosynthetic algae shown in Figure 2.4 are classified as
decomposers
consumers
parasites
producers
The term "biodiversity" refers to
The number and variety of species that live in an area.
The number and variety of species living on Earth.
The number and variety of species that are considered renewable.
At each stage of the trophic levels, how much energy is lost?
99%
10%
90%

The diagram shows a model that Peter made of the carbon cycle. CO₂ cycle. Which mistake did Peter make in the model?
Plants do not lose carbon through respiration.
The burning of fossil fuel does not release carbon.
Organisms that decay do not deposit carbon in the soil.
Animals do not breathe carbon dioxide from the atmosphere.
Which of the following is not a likely component of soil formed during primary succession?
dust particles from the air
cast-off parts of shrubs and trees
broken bits of stone and rock
decayed lichens and bacteria
The energy in most ecosystems comes from
the sun.
wind.
green plants.
All of the above
In developing countries, you are most likely to find biomass used
for heating and cooking.
as a source of hydropower.
for manufacturing.
to generate electricity.
A geothermal power plant can be used to generate electricity
none of the above.
in areas where the ground stays warm throughout the year.
anywhere in the U.S.
in areas where reservoirs of water are heated deep inside Earth.
Which of the following is an advantage of nuclear energy?
It poses no safety risks.
It does not produce air pollution.
It is cost-efficient.
It does not produce solid waste.
What is reforestation?
removing all trees from an area
None of the above
replanting trees in an area
removing selected trees from an area
Acid precipitation can be traced back to
thermal inversions.
the use of electrostatic precipitators.
the burning of fossil fuels.
the release of particulate matter into the atmosphere.
What element is often used as a power source of nuclear energy?
Carbon
Hydrogen
Sulfur
Uranium

According to the US Energy Consumption graph. Approximately, what percentage of the energy used in the US comes from non-renewable resources?
8%
17%
78%
90%

Between 1988 and 1995, the North America cod (fish) population collapsed due of overharvesting. What might the government have done to help the population begin to grow in 1996?
Set limits on cod fishing.
Allow unlimited fishing of cod.
Increased cod fishing in some areas.
Ordered people to stop eating cod.
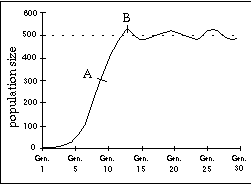
What is the carrying capacity of the graph?
around 500
more than 800
less than 300
around 700

Based on the graph, what happens to the amount of kelp as sea otter numbers decrease?
As the sea otter population decreases, kelp increases.
As the sea otter population decreases, kelp decreases.
As the sea otter population decreases, kelp doesn't change.
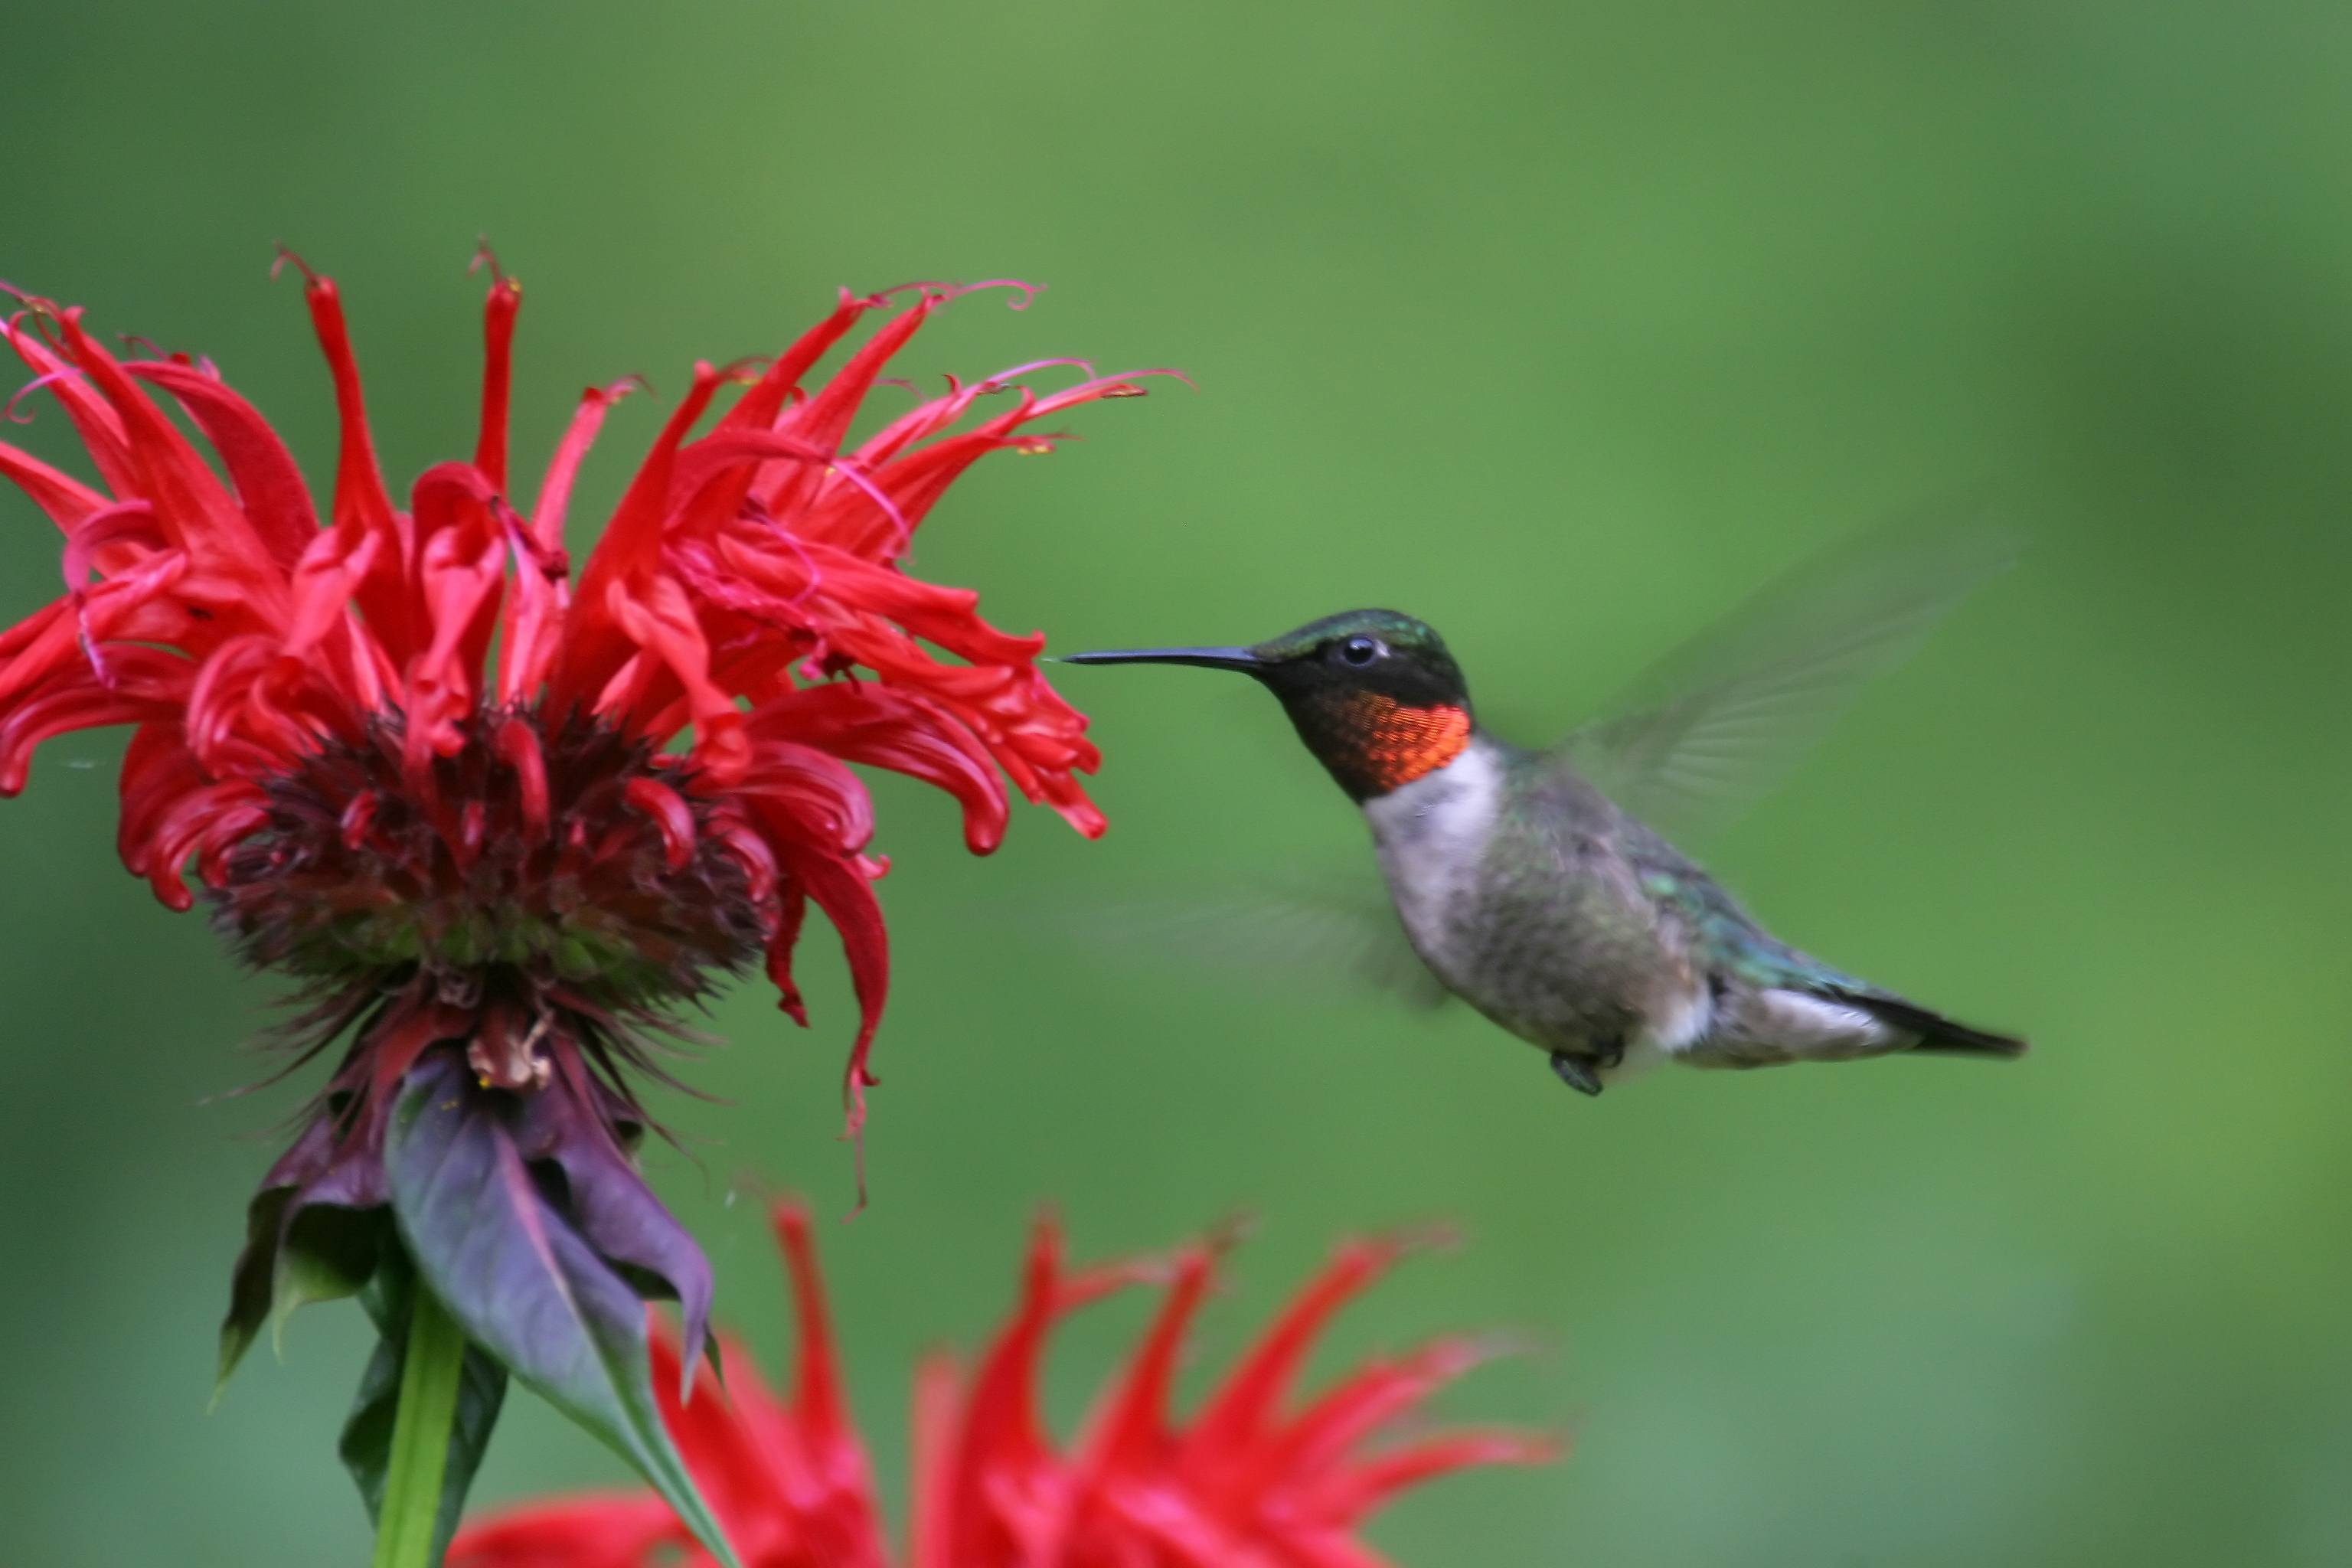
*Hermit crabs find shells left by snails that have died and move in.
* Snails die and leave behind their shells.
Why would healthy lifestyles and advanced medical care reduce the deathrate?
lower life expectancy
birthrate increases
higher life expectancy
gni falls

In which area on the map is MOST likely that more than 35% of the people are malnourished?
A
B
C
D

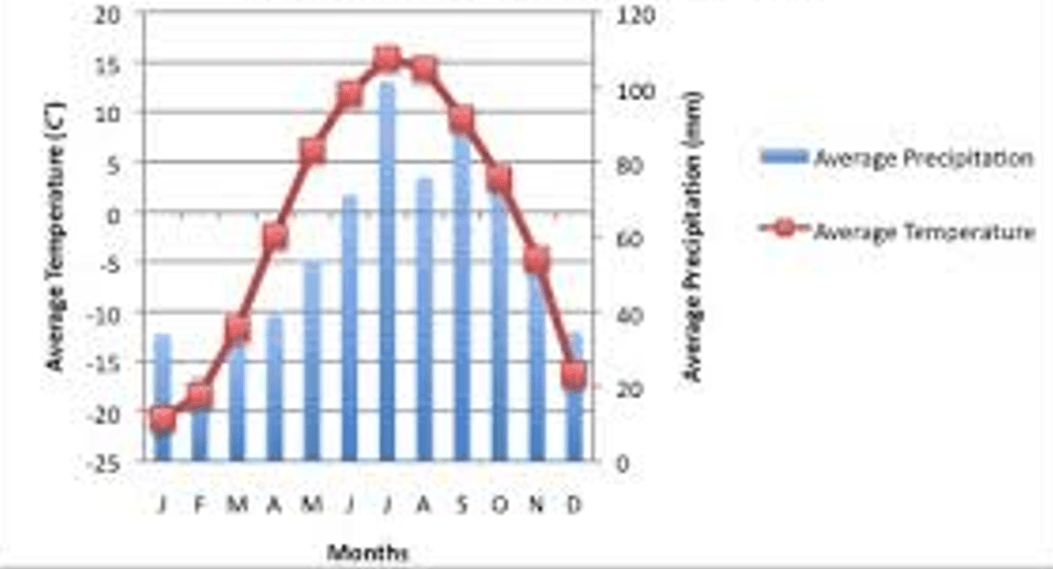
Which month has the highest precipitation?
July
August
September
June

