
Font size
 Worksheets
Practice 12.8.23
Total questions: 71
Worksheet time: 1hrs 7mins
When deciding whether a relation represents a function.....
x and y values cannot repeat
x values cannot repeat
y values cannot repeat
x and y values can repeat
Which of the following represents a function?
{(1,2), (1,3), (1,4), (1,5)}
{(1,2), (2,3), (3,4), (4,5)}
{(1,2), (3,4), (3,5), (6,7)}
{(1,2), (3,4), (5,6), (5,8)}
Which of the following tables does NOT represent a function?


Which of the following mappings represents a function?


Which of the following sets of coordinates represents a function?
{(5,9), (9,11), (7,3), (5,-2)}
{(-6,2), (-5,3), (-6,1), (-5,4)}
{(-4,2), (-4,3), (-4,4), (-4,5)}
{(1,8), (2,8), (3,8), (4,8)}

Which of the tables represents a function?
Table A
Table B
Both Tables A & B represent functions
Neither table represents a function

Which mapping represents a function?
Mapping A
Mapping B
Both Mapping A and Mapping B represent functions
Neither Mapping represents a function
A function is a relation in which each _________ is paired with _____ _________.
y-value.... two x-values
x-value.... two y-values
y-value.... one x-value
x-value.... one y-value
Which value of w would allow these coordinates to represent a function?
{(4,-9), (6,0), (-3,2), (-5,7), (w,1)}
-3
-5
6
0

What value of m would result in this table representing a function?
3
6
2
Any value of m would make this a function.

This mapping does not represent a function.
Why not?
Because two inputs (-3 & -2) result in the same output (7)
Because one of the inputs (-3) can result in two outputs (5 & 6)
Because the arrows don't cross
Because the inputs are negative put the outputs are positive
Which of the following represent a function? (Pick 2)
{(9,-7), (7,-5), (4,-2), (3, -8)}
{(3,5), (4,6), (5,7), (4,8)}
{(6,3), (4,9), (-2,-7), (-8,-5)}
{(-2,0), (0,3), (4,5), (0,7)}
Which tables represent functions? (Select 2)


Does this mapping represent a function?
No, because two inputs map to 0
No, because two inputs map to 1
Yes, because 0 maps to 0 and 1 maps to 1
No, because the inputs can result in more than one output
What value of b would make this set of coordinates NOT a function?
{(-5,3), (-3,2), (0,4), (2,6), (-1,8), (b,-7)}
-7
-3
4
6

Tell me about this table (choose 2):
It represents a function
It does NOT represent a function
Because the x-values repeat
Because the x-values do NOT repeat

Tell me about this mapping (select 2):
It represents a function
It does NOT represent a function
Because one input (4) results in two outputs (-5 & 0)
Because two inputs (6 & -3) result in one output (4)
Which set of coordinates represent a function? (Select all that apply)
{(1,1), (2,2), (3,3), (4,4), (5,5)}
{(1,5), (2,4), (3,3), (4,2), (5,1)}
{(3,6), (4,7), (5,8), (6,9), (4,0)}
{(-2,0), (0,-2), (3,-5), (-5,3), (10,-6), (-6, 10)}
Which tables represent functions? (Select all that apply!)


Which of the following mappings do NOT represent functions? (Select all that apply!)


Jacob conducts an egg-drop experiment. He drops it from 32 feet in the air and it falls at 4 feet per minute. Write a linear equation to represent this situation.
y = -4x+32
y = 32x+4
y = -4x+8
y = -8x+32
Jacob conducts an egg-drop experiment. He drops it from 32 feet in the air and it falls at 4 feet per minute. How many feet above ground will the egg be after 5 minutes?
8
-20
12
3
An airplane is 30,000 feet above ground and descends at the rate of 2,000 feet per minute. How many feet above ground is the plane after 3 minutes?
18,000 feet
24,000 feet
10,000 feet
15,000 feet
Michael has $650 in his savings account. He withdraws $50 each week. Write a linear equation to represent the relationship between the weeks and the total money left in his savings account.
y = -650x+50
y = -50x+650
y = 13x + 50
y = -13x+650
Michael has $650 in his savings account. He withdraws $50 each week. How much money is in his savings account after 5 weeks?
$250
$650
13 weeks
$400
A train is 500 meters above ground and descends at the rate of 50 meters per minute. What is the slope/rate?
-50
500
y = 10
5
A train is 500 meters above ground and descends at the rate of 50 meters per minute. What is the y-intercepet?
50
500
y = 10
5
A train is 500 meters above ground and descends at the rate of 50 meters per minute. What does x represent?
minutes
meters
feet
seconds
A train is 500 meters above ground and descends at the rate of 50 meters per minute. What does y represent?
minutes
meters
feet
seconds
A train is 500 meters above ground and descends at the rate of 50 meters per minute. Write a linear equation to represent this situation.
y = 50x-500
y = -50x+500
y = -500x+50
y = 50x+500
John has $800 in his savings account. He withdraws $100 each week. Write a linear equation to represent the relationship between the weeks and the total money left in his savings account.
y = -800x+100
y = -100x+800
y = 8x + 100
y = -8x+800
Lisa saves $20 every week. If she already has $200 in her savings account, write a linear equation to represent the total amount of money in her savings account after x weeks.
y = 20x + 200
y = 200x + 20
y = -20x + 200
y = 20x - 200
Lisa saves $20 every week. If she already has $200 in her savings account. What is the slope/rate and what is the y-intercept?
m = 200
b = 20
m = -20
b = 200
m = 20
b = 200
m = -200
b = 20
A balloon is released and rises at a steady rate of 100 feet per minute. If the balloon starts at a height of 50 feet, write a linear equation to represent the height of the balloon after x minutes.
y = 100x + 50
y = 50x + 100
y = -100x + 50
y = 100x - 50
What is a y-intercept?
a vertical line
the point where the line crosses the x-axis
a horizontal line
the point where the line crosses the y-axis

y = -3x + 4

Which value is the y-intercept in the equation:
y= 2x - 2
2
-2
1
the line doesn't cross the y-axis



Which equation matches the table?
y = x + 5
y = 5x
y = x - 5
y = x - 5

The table shows the x and y values for the equation
y = 2x + 1.
Find the missing y value.
-2
3
9
-7

Which equation matches the table?
y = x + 8
y = 2x + 3
y = x + 10
y = 3x - 4
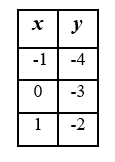
Which graph represents the table?
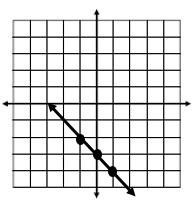
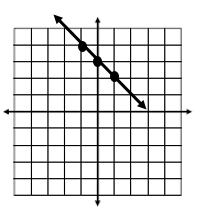
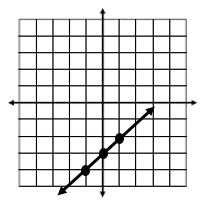
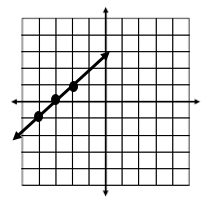

Which graph represents the table?


Which graph shows the correct line for the table?


Which table is correct for y = -3/2x + 5


Which is the graph of the equation y = -3x - 1? (hint: make a table)


√5?
√.81
9
.09
.9
Not Possible
√-9
3
-3
81
Not possible
Which of the following is a perfect square?
10
25
50
89
Which of the following in not a perfect square?
49
81
111
144



