
 Worksheets
Population Ecology Practice 2024
Total questions: 19
Worksheet time: 38mins

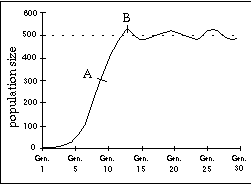
In the graph to the right, what is the population of deer at the carrying capacity of the environment?
3
7
70
40

What will happen if all of the frogs in a population die?
The frogs' predators will decrease and the frogs' prey will increase
The frogs' predators will increase and the frogs' prey will decrease
We better all pray because there isn't anymore frogs.
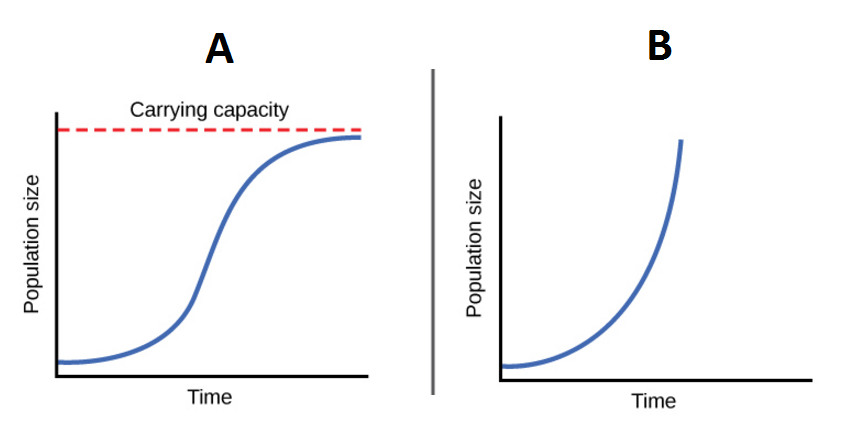
What type of growth model is shown in image A?
Exponential
Logistic
What type of growth model is shown in image B?
Exponential
Logistic

What does the yellow line represent?
exponential growth
logistic growth
carrying capacity
none of the above
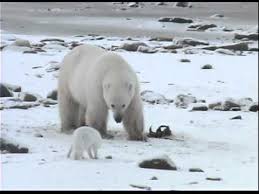
Two arctic fox are fighting with a polar bear for a sea lion carcass. One fox distracts the bear while the other eats. What type of limiting factor is the polar bear?
Predator-Prey Relationships
Competition
Herbivory Effect
Weather

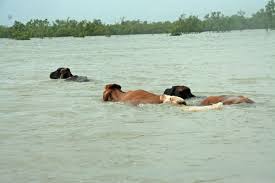
A group of elephants gets stuck in mud at the edge of the river from a recent mud slide. A lion waits for an elephant to get tired before it attacks. What is the limiting factor to the elephant population?
Predator-Prey Relationships
Natural Disaster
Herbivory Effect
Competition

Which of these is a biotic factor in a river ecosystem?
the types of microorganisms that live in the river water
the amount of soil and other particles carried by the river
the speed at which the river water flows toward the ocean
the amount of rain that flows off the land and into the river
They point to the organism that is being eaten.
It shows how sunlight flows within an ecosystem.
They show what direction the energy is flowing between organisms.
They represent how water is transferred within a habitat.

The populations of which organisms will most likely increase as a result of a disease that suddenly reduced the population of Texas horned lizards?
Grasses and ants
Ants and grasshoppers
Grasshoppers and Texas Cottonmouths
Texas cottonmouths and red shouldered hawks

What has happened to the birth rate compared to the death rate of this population?
the death rate is greater than the birth rate
the death rate and birth rate are equal
the birth rate is greater than the death rate
the birth rate is increasing
What is happening to the birth rate vs death rate for the population at letter A?
birth rate is more than the death rate
death rate is greater than the birth rate
the birth rate and death rate are equivalent
population is extinct

The graph to the right shows the interaction of the wolf and moose populations on Isle Pekie. If the moose population continues to increase, the wolves' food supply will increase. What type of relationship is represented by this graph?
parasitism
predator-prey
commensalism
mutualism
Which of the following best describes a reason for an increase in predator populations?
an increase in prey populations
an increase in vegetation to eat
a decrease in prey populations
excessive rainfall in a given month
The graph to the right shows the interaction of the wolf and moose populations on Isle Pekie. If the moose population continues to increase, the wolves' food supply will increase. What will most likely happen to the wolf population as a result?
It will decrease.
It will increase.
It will remain the same.

