
 Worksheets
Human Population Growth Test
Total questions: 40
Worksheet time: 37mins
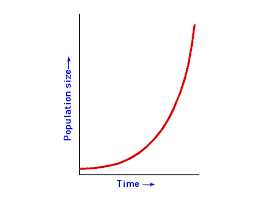
Identify the type of population growth shown on the graph.
logistic growth
exponential growth
predator-prey cycle
boom-bust curve
(a) is the scientific study of human populations.
Age structure diagrams shows the population of a country broken down by:
Age
Gender
Both Choices: Age and Gender
In which stage of the demographic transition does the birth rate fall to meet the death rate?
Stage III
Stage I
Stage II
Stage IV
How will the population change
2 factors which decrease population size
Birth Rate, Immigration
Death Rate, Immigration
Birth Rate, Emigration
Death Rate, Emigration
When people leave a population and move away
Emigration
Immigration
Birth Rate
Death Rate
When people move into and join a new population
Immigration
Birth Rate
Death Rate
Emigration

How would you describe the population of this country?
They are experiencing stable population growth
They are experiencing negative population growth
They are experiencing rapid population growth

The average number of people living in a square kilometer or square mile is called...
urbanization.
internal migration.
population density.
pull factors.

Which correctly describes the term demographic transition?
The transition from low birth rates and death rates to high birth rates and death rates as a country develops.
The transition from high birth rates and death rates to low birth rates and death rates as a country develops.
The transition from high birth rates to low death rates as a country develops.
The transition from low birth rates to high death rates as a country develops.

Using Figure 5–6, describe the type of growth Mexico is experiencing.
Mexico is experiencing a rapid growth rate because there are more children than adults.
Mexico is experiencing no growth because people are living longer.
Mexico is experiencing slowed growth because there are fewer adults.
Mexico is experiencing a rapid decline because there are more children than adults.

Select the 2 that apply for Stage 4 of the DTM
Birth rate is low
Birth rate is high
Population is increasing quickly
Population is high and stable
Select the 2 that apply for Stage 2 of the DTM
Death rate is falling
Birth rate is high
Population is decreasing
Death rate is high
Select the 2 that apply for Stage 1 of the DTM
Birth rate is low
Death rate is high
Population is low
Death rate is low
How many stages are there in the Demographic Transition Model?
2
3
4
6
What does DTM stand for?
Demographic Transnational Modelling
Demographic Transition Model
Decreasing Thermal Medicines
Developing Transition Model

What does the whole left side of the population pyramid represent?
Males
Females
The working class
The young

What age group does the top of the population pyramid represent?
The working people
The rich people
The elderly
The young people

What age groups does the bottom of a population pyramid represent?
The elderly
The working adults
The children
Males

What population is displayed on the RIGHT side of this pyramid?
Children
Women
Men
Elderly

What type of growth is shown on this graph?
Logistic
Exponential
Carrying Capacity

Does the graph represent an exponential growth or logistic growth?
Exponential Growth
Logistic Grwoth

Population growth is...
Change in population size
The number of live births per 1000 people per year
The number of death per 1000 people per year
Number of people living in a unit area of land

In Stage 2, the Total Population is...
Growing Slowly
Growing Quickly
Not Growing

In Stage 3, the Death rate is...
High
Dropping slowly
Low

In Stage 4, the Birth rate is...
High
Rising
Low

In Stage 4, the Death rate is...
High
Rising
Low

In Stage 4, the Total Population is...
Growing Quickly
Leveling Out
Decreasing Quickly
Why was the one child policy needed?
China was at war
It wasn't needed
Concerns about running out of enough food or electricity
China's population was nearly 1 billion


