
Font size
 Worksheets
STAT250_WEEK7
Total questions: 17
Worksheet time: 10mins

The weights of 9 young children are followed up to see if they are growing up properly. Specifically, the weights of each child are measured once in January and then in July. The data and some summary statistics are given:
The degrees of freedom for this test is
9
10
8
16
Pearson correlation is between...
[-1,inf]
[1,inf]
[-1,1]
[-inf, inf]
Covariance is between...
[-1,1]
[-inf, inf]
[0,inf]
[1, inf]
In testing a hypothesis about the difference between two proportions, the p-value is computed to be 0.043. The null hypothesis should be rejected if the chosen level of significance is 0.05.
TRUE
FALSE
The sample size in each independent sample must be the same in order to test for differences between the proportions of two independent populations.
TRUE
FALSE
The pooled-variance t test assumes that the population variances in the two independent groups are equal.
TRUE
FALSE
When we use F-test?
To compare two pupulation mean
To compare two pupulation variance
To compare two pupulation proportion
To compare one pupulation variance
If Fα,n1,n2 = 0.5, what is F1-α,n1,n2 ?
2
5
0.5
4
What is the R function to check normality?
wilk.test()
norm.test()
t.test()
shapiro.test()
If we try to investigate the relationship between two quantitative variables, which one/s can we use?
Covariance
Pie Chart
Bar Plot
Scatter Plot
Correlation
When X and Y are independent, Cov(X,Y)=0.
TRUE
FALSE
Spearman’s rho (ρ) is appropriate for both discrete and continuous variables.
TRUE
FALSE
Kendall correlation between two variables will be LOW when observations have a similar rank.
TRUE
FALSE
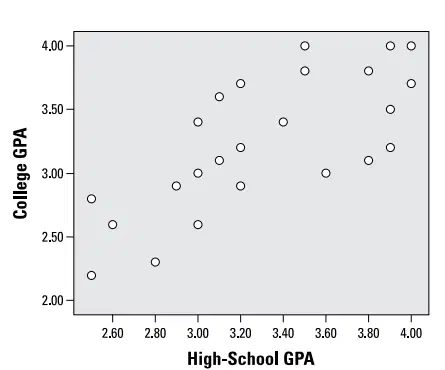
How would you describe the relationship between high-school GPA and college GPA?
strong
weak
linear
positive
negative
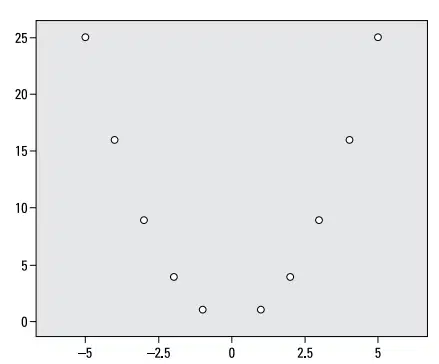
There is no relationship between two variables.
TRUE
FALSE
If kendall's τ = -0.87, there are ....
negative association between the variables.
positive association between the variables.
strong association between the variables.
weak association between the variables.
X and Y are independent.
If corr(X,Y) = 0, then we can say that there is no relationship between X and Y.
TRUE
FALSE

