
 Worksheets
Economics Review
Total questions: 50
Worksheet time: 50mins
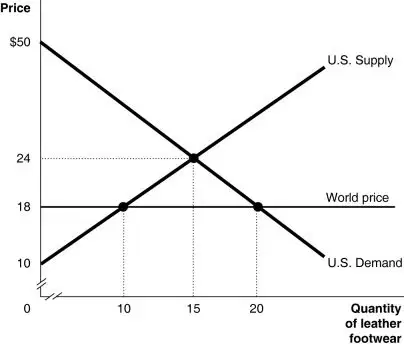
Figure 9-1 shows the U.S. demand and supply for leather footwear.
Refer to Figure 9-1. Under autarky, the consumer surplus is
$260.
$555.
$195.
$300.
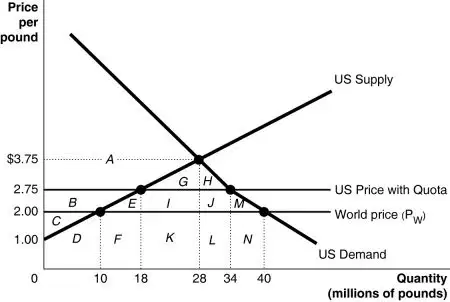
Since 1953 the United States has imposed a quota to limit the imports of peanuts. Figure 9-3 illustrates the impact of the quota.
Refer to Figure 9-3. With a quota in place, what is the quantity supplied by domestic producers?
10 million pounds
8 million pounds
18 million pounds
16 million pounds
Trade between countries that is without restrictions is called
free trade.
unabated trade.
unencumbered trade.
unobstructed commerce.
The "Buy American" provision in the 2009 stimulus package required that stimulus money be spent only on U.S.-made goods, effectively acting as a quota of zero imports when stimulus money was being spent. In the market for steel, the "Buy American" provision would ________ the price of steel in the United States and ________ the quantity of steel demanded in the United States.
increase; decrease
decrease; decrease
increase; increase
decrease; increase
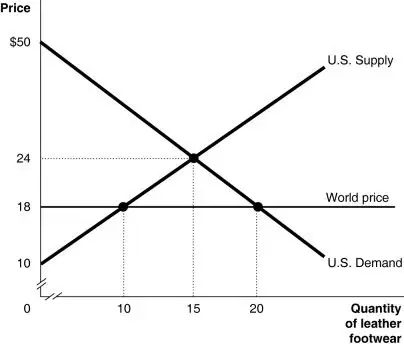
Figure 9-1 shows the U.S. demand and supply for leather footwear.
Refer to Figure 9-1. Suppose the government allows imports of leather footwear into the United States. The market price falls to $18. What is the value of domestic producer surplus?
$0
$320
$40
$360
Which of the following is the best example of a tariff?
a tax placed on all residential air conditioners sold in the domestic market to help offset the impact of emissions on the environment
a $150 fee imposed on all imported residential air conditioners
a subsidy from the U.S. government to domestic manufacturers of residential air conditioners to enable them to compete more effectively with foreign producers
a limit on the quantity of residential air conditioners that can be imported from a foreign country
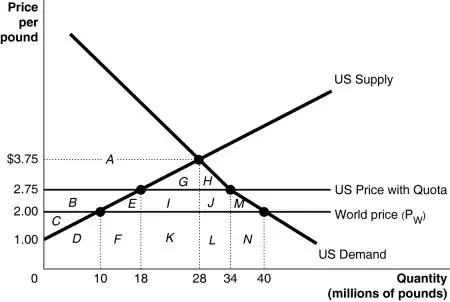
Since 1953 the United States has imposed a quota to limit the imports of peanuts. Figure 9-3 illustrates the impact of the quota.
Refer to Figure 9-3. What is the area that represents revenue to foreign producers who are granted permission to sell in the U.S. market when there is a quota?
E + I + J + M
I + J
G + H + I + J
I + J + K+ L
Under autarky, consumer surplus is represented by the area
above the supply curve and below the equilibrium price.
above the demand curve and below the supply curve.
below the demand curve and above the equilibrium price.
above the supply curve and below the demand curve.
In order to avoid the imposition of other types of trade barriers, foreign producers will sometimes agree to voluntary export restraints. With voluntary export restraints, foreign producers
limit their exports to a country.
agree to meet specific quality standards required by the importing country.
must agree to import an equal quantity of products that they export.
pay a tax on all products they export.

Since 1953 the United States has imposed a quota to limit the imports of peanuts. Figure 9-3 illustrates the impact of the quota.
Refer to Figure 9-3. What is the area that represents the deadweight loss as a result of the quota?
E + M
G + H + I + J
G + H
E + I + J + M
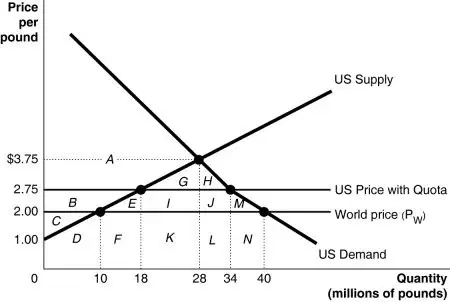
Since 1953 the United States has imposed a quota to limit the imports of peanuts. Figure 9-3 illustrates the impact of the quota.
Refer to Figure 9-3. If there was no quota, how many pounds of peanuts would be imported?
16 million
40 million
24 million
30 million
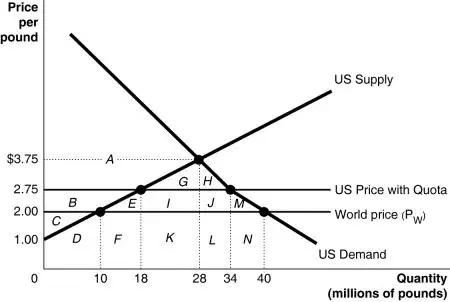
Since 1953 the United States has imposed a quota to limit the imports of peanuts. Figure 9-3 illustrates the impact of the quota.
Refer to Figure 9-3. If there was no quota, how many pounds of peanuts would domestic consumers purchase?
10 million
28 million
34 million
40 million
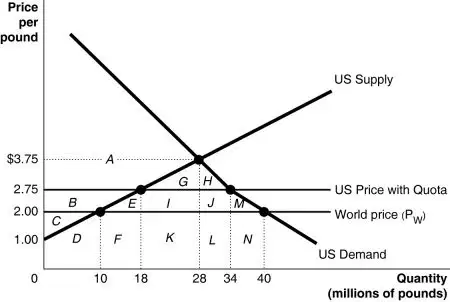
Since 1953 the United States has imposed a quota to limit the imports of peanuts. Figure 9-3 illustrates the impact of the quota.
Refer to Figure 9-3. What is the area of domestic producer surplus after the imposition of a quota?
B + E + I + J + M
B + C
E + I + J + M
B
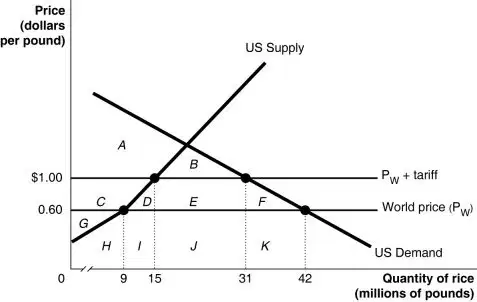
Suppose the U.S. government imposes a $0.40 per pound tariff on rice imports. Figure 9-2 shows the impact of this tariff.
Refer to Figure 9-2. The loss in domestic consumer surplus as a result of the tariff is equal to the area
C + D + E + F.
D + E + F.
B.
B + D + E + F.
Which of the following is the best example of a voluntary export restraint?
a subsidy granted by the U.S. government to domestic cell phone manufacturers so they can compete more effectively with foreign cell phone manufacturers
a limit set by the Korean government on the number of cell phones that the United States can import from Korea
a $50 per-cell phone fee imposed on all cell phones imported into the United States
a limit imposed by the U.S. government on the number of cell phones that the United States can import from Korea
A numerical limit imposed by a government on the quantity of a good that can be imported into the country is called a
Barricade.
quantity floor.
Quota.
tariff.
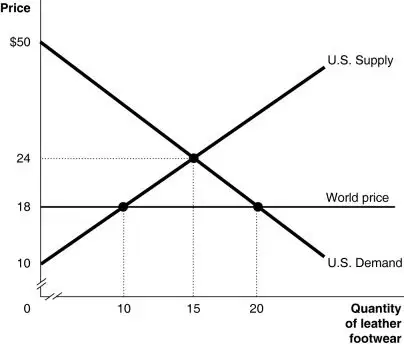
Figure 9-1 shows the U.S. demand and supply for leather footwear.
Refer to Figure 9-1. Suppose the government allows imports of leather footwear into the United States. What will the market price be?
>$24
$10
$24
$18
In reaction to the passage of the Smoot-Hawley Tariff, Canada as well as many other U.S. trading partners
refused to import any products from the United States.
enacted large increases in tariffs on U.S. imports.
eliminated tariffs on U.S. imports.
refused to export any products to the United States.
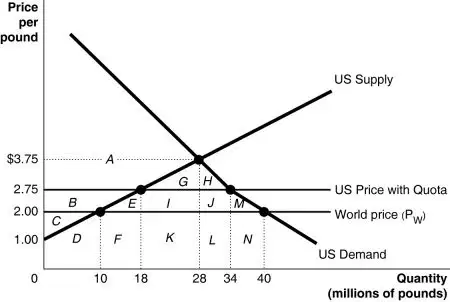
Since 1953 the United States has imposed a quota to limit the imports of peanuts. Figure 9-3 illustrates the impact of the quota.
Refer to Figure 9-3. What is the area of consumer surplus after the imposition of the quota?
G + H + E + I+ J + M
A
A + G + H
G + H
A quota
makes both domestic producers and consumers better off.
makes everyone worse off.
makes domestic consumers better off.
makes domestic producers better off.
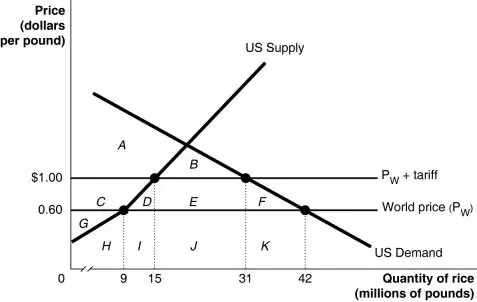
Suppose the U.S. government imposes a $0.40 per pound tariff on rice imports. Figure 9-2 shows the impact of this tariff.
Refer to Figure 9-2. The tariff revenue collected by the government equals the area
E.
B + D + E + F.
C + D + E + F.
D + E + F. X
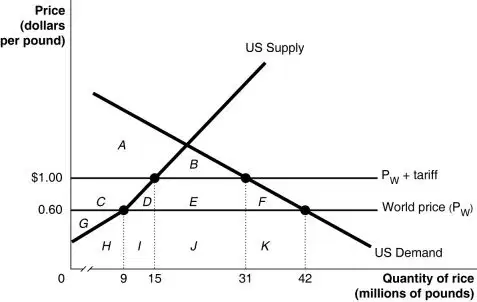
Suppose the U.S. government imposes a $0.40 per pound tariff on rice imports. Figure 9-2 shows the impact of this tariff.
Refer to Figure 9-2. With the tariff in place, the United States consumes
42 million pounds of rice
9 million pounds of rice
31 million pounds of rice
15 million pounds of rice.

Figure 9-1 shows the U.S. demand and supply for leather footwear.
Refer to Figure 9-1. Under autarky, the deadweight loss is
$30.
$40
$0.
$15
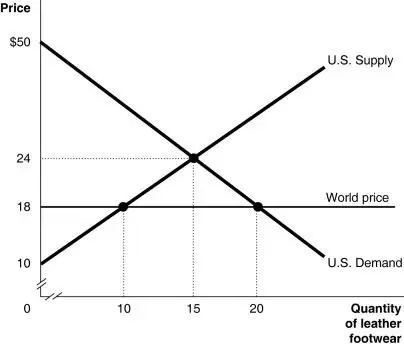
Figure 9-1 shows the U.S. demand and supply for leather footwear.
Refer to Figure 9-1. Suppose the government allows imports of leather footwear into the United States. The market price falls to $18. What is the value of consumer surplus?
$270
$0
$305
$320
A tariff is
a subsidy granted to importers of a vital input.
a limit placed on the quantity of goods that can be imported into a country.
a tax imposed by a government on goods imported into a country.
a health and safety restriction imposed on an imported product.

Suppose the U.S. government imposes a $0.40 per pound tariff on rice imports. Figure 9-2 shows the impact of this tariff.
Refer to Figure 9-2. If the tariff was replaced by a quota which limited rice imports to 16 million pounds, the amount of additional revenue received by rice importers would equal
$9.6 million.
$19.8 million.
$6.4 million.
$16 million.
A tariff
makes domestic consumers worse off.
makes everyone better off.
makes both domestic producers and consumers worse off.
makes domestic producers worse off.
Which of the following is the best example of a quota?
a 40% fee imposed on all imported tires
a subsidy from the U.S. government to domestic manufacturers of tires to enable them to compete more effectively with foreign producers
a tax placed on all tires sold in the domestic market to help offset the impact of lost jobs in the domestic tire industry
a limit on the quantity of tires that can be imported from a foreign country
The main purpose of most tariffs and quotas is to
reduce the foreign competition that domestic firms face.
improve the quality of goods and services imported into the country.
reduce the prices consumers pay for goods and services.
raise revenue for the government.

Suppose the U.S. government imposes a $0.40 per pound tariff on rice imports. Figure 9-2 shows the impact of this tariff.
Refer to Figure 9-2. With the tariff in place, the United States
imports 16 million pounds of rice.
imports 9 million pounds of rice.
exports 31 million pounds of rice.
imports 15 million pounds of rice.
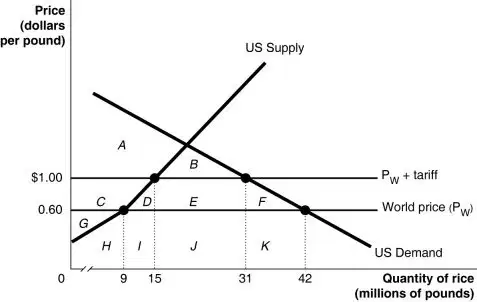
Suppose the U.S. government imposes a $0.40 per pound tariff on rice imports. Figure 9-2 shows the impact of this tariff.
Refer to Figure 9-2. With the tariff in place, the United States produces
9 million pounds of rice.
42 million pounds of rice.
15 million pounds of rice
31 million pounds of rice
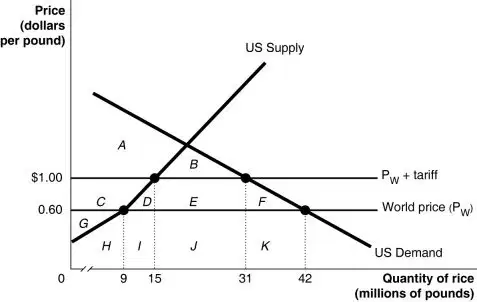
Suppose the U.S. government imposes a $0.40 per pound tariff on rice imports. Figure 9-2 shows the impact of this tariff.
Refer to Figure 9-2. As a result of the tariff, domestic producers increase their quantity supplied by
6 million pounds of rice.
22 million pounds of rice.
15 million pounds or rice.
31 million pounds of rice.
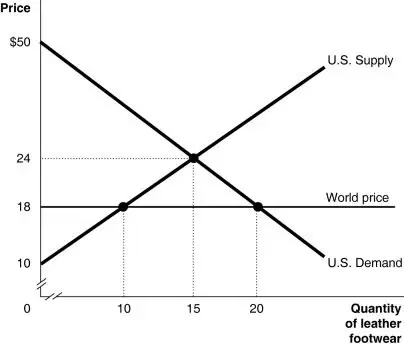
Figure 9-1 shows the U.S. demand and supply for leather footwear.
Refer to Figure 9-1. Suppose the government allows imports of leather footwear into the United States. What will be the quantity of imports?
10 units
5 units
15 units
20 units

Suppose the U.S. government imposes a $0.40 per pound tariff on rice imports. Figure 9-2 shows the impact of this tariff.
Refer to Figure 9-2. Without the tariff in place, the United States consumes
42 million pounds of rice.
31 million pounds of rice.
15 million pounds of rice.
9 million pounds of rice.
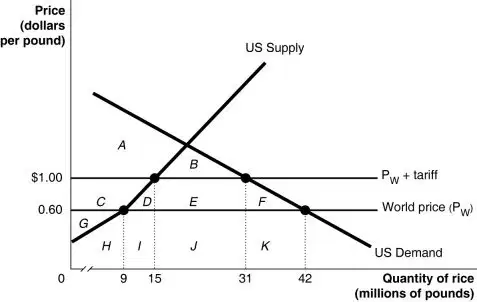
Suppose the U.S. government imposes a $0.40 per pound tariff on rice imports. Figure 9-2 shows the impact of this tariff.
Refer to Figure 9-2. Without the tariff in place, the United States produces
15 million pounds of rice.
42 million pounds of rice.
9 million pounds of rice.
31 million pounds of rice
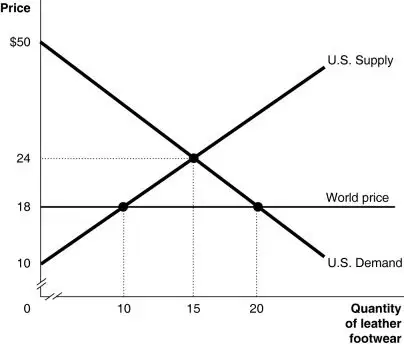
Figure 9-1 shows the U.S. demand and supply for leather footwear.
Refer to Figure 9-1. Under autarky, the producer surplus is
$195.
$105.
$40.
$285.
What is the government purchases multiplier if the tax rate is 0.2 and the marginal propensity to consume is 0.8? Assume the economy is closed.
6.25
5
100
2.78
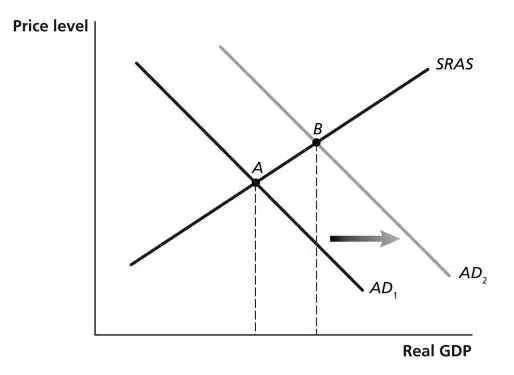
Refer to Figure 16-12. An increase in government purchases causes aggregate demand to shift ultimately from AD1 to AD2. In the new equilibrium at point B, both real GDP and the price level have increased. The increase in real GDP is ________ than that indicated by the multiplier effect with a constant price level.
less than
equal to
greater than
There is insufficient information given here to draw a conclusion.
Compare the effect on the price level and real GDP of a decrease in tax rates assuming a supply-side effect versus no supply-side effect. Compared to no supply-side effect, including a supply-side effect for the decrease in tax rates will cause the price level to increase ________ and real GDP to increase ________.
less; more
more; more
more; less
less; less
The Congressional Budget Office estimates the size of the tax multiplier to be ________ for a 2-year tax cut for lower- and middle-income people.
0.3 - 1.5
0.1 - 0.6
0.5 - 2.5
2.0 - 3.0
Economists refer to the series of induced increases in consumption spending that result from an initial increase in autonomous expenditures as the ________ effect.
Consumption
aggregate demand
Expenditure
multiplier
In an open economy, the government purchases multiplier will be larger the
All of the above are correct
smaller the marginal income tax rate.
larger the marginal propensity to consume.
smaller the marginal propensity to import.
An increase in government spending may expedite recovery from a recession in the short run, but in the long run this policy may
reduce investment in new capital
All of the above are correct.
make domestic businesses less competitive in international markets as the dollar appreciates in value.
raise interest rates and reduce consumer expenditures on automobiles and new houses
Suppose Congress increased spending by $100 billion and raised taxes by $100 billion to keep the budget balanced. What will happen to real equilibrium GDP?
Real equilibrium GDP will fall
Real equilibrium GDP will initially rise, but then fall below its previous equilibrium value
Real equilibrium GDP will rise
There will be no change in real equilibrium GDP
Which of the following statements about the Social Security, Medicare, and Medicaid programs is true?
Costs are being driven up by the fact that Americans are living longer and medical costs are rising substantially.
Some economists have argued for increasing benefits to help with these programs' funding problems.
Some economists have argued for decreasing taxes to help with these programs' funding problems.
Spending on these three programs will rise from 10.2% of GDP currently to 19.7% of GDP by 2040.
The impact of crowding out may be the least
when real GDP is below but close to potential GDP.
during an expansion.
during a deep recession.
when real GDP is above but close to potential GDP
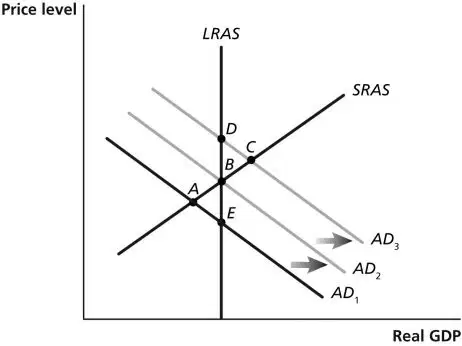
Refer to Figure 16-1. Suppose the economy is in short-run equilibrium above potential GDP and wages and prices are rising. If contractionary policy is used to move the economy back to long run equilibrium, this would be depicted as a movement from ________ using the basic AD-AS model in the figure above.
C to B
A to E
B to A
D to C
The federal government debt equals
the accumulation of past budget deficits
government spending minus tax revenues.
tax revenues minus government spending.
the total value of U.S. Treasury bonds outstanding.
The largest and fastest-growing category of federal government expenditures is
interest on the national debt
grants to state and local governments
transfer payments
national park spending
A one-time tax rebate, which is not expected to be extended in future years, will
have a significant positive effect on consumption and aggregate demand, with aggregate demand growing by a multiple of the tax rebate. X
increase aggregate supply and aggregate demand.
have a moderately positive effect on consumption and aggregate demand.
have no effect on consumption and aggregate demand.

