
 Worksheets
AP EXAM REVIEW: Graphs and Equations!
Total questions: 39
Worksheet time: 33mins
If the slope of a position-time graph is constant, what does this indicate about the motion of the object?
The object is accelerating.
The object is at rest.
The object is moving at a constant velocity.
The object is changing direction.
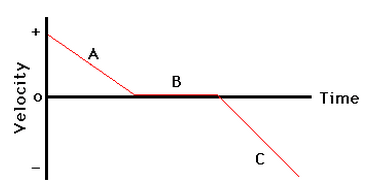


Describe the motion in segment A
Slowing down; Positive direction
Slowing down; Negative direction
Speeding up; Negative direction
Constant velocity; Negative direction

What is the displacement of the object between 0 and 4 seconds?
10 m
8 m
12 m
16 m

A person throws a marble straight up into the air, releasing it a short height above the ground and catching it at that same height. If air resistance is negligible, which of the following graphs of position y versus time t is correct for the motion of the marble as it goes up and then comes down?


The area of a force vs position graph has units of...
Newtons
Kg
Watts
Joules
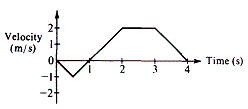
The graph above shows the velocity versus time for an object moving in a straight line. At what time after t = 0 does the object again pass through its initial position?
Between 0 and 1
1 s
Between 1 and 2 s
2s
Between 2 and 3 s
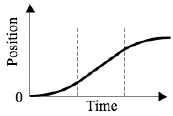
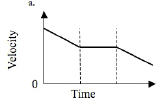
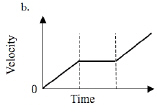
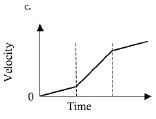
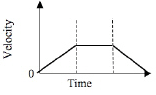
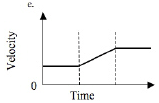
The graph given here shows the position vs. time for an object traveling along the x-axis. Which graph below shows the velocity vs. time for this same object during the same time period?

The slope of this graph represents the (a) of a spring.

The slope of this graph represents
the (a) .

The slope of this graph represents the (a) .
The area under the curve of this graph represents the (a) .

What does the area under the curve of this graph represent? Select all that apply.
change in energy
acceleration
total energy

What does the area under the curve of this graph represent? Select all that apply.
work done on the spring
stored elastic potential energy
kinetic energy
gravitational potential energy

What does the area under the curve of this graph represent? Select all that apply.
change in energy
work
What does the area under the curve of this graph represent?
(a)
A rubber ball is held motionless a height ho above a hard floor and released. Assuming that the collision with the floor is elastic, which one of the following graphs best shows the relationship between the total energy E of the ball and its height h above the surface.


If you graphed net force on the y-axis and acceleration on the x-axis, what graph shape would you make? (Hint: look at the equation)

y squared

x squared

linear

linear with a y-intercept
If you graphed vf on the y-axis and Δx on the x-axis for an accelerating object, what graph shape would you make? (Hint: look at the equation)
y squared
x squared
linear
linear with a y-intercept
Match these line graphs with their slopes and vice versa. Assume the graph titles follow the pattern y vs x.
slope: 1/m
graph: a vs Fnet
graph: x vs t (constant velocity)
slope: v
slope: (1/2)a
x vs t2 (constant acceleration)
graph: Fg vs. 1/r2
slope: Gm1m2
slope: 4π2/g
T2 vs length (pendulum)

A horizontal disk of radius 0.2m and mass 0.3kg is mounted on a central vertical axle so that a student can study the relationship between net torque and change in angular momentum of the disk. In the experiment, the student uses a force probe to collect data pertaining to the net torque exerted on the edge of the disk as a function of time, as shown in the graph. The disk is initially at rest. At what instant in time does the disk have the greatest angular momentum?
0.00 s
1.00 s
1.75 s
2.50 s
A horizontal disk is mounted on a central vertical axle. In the experiment, the student uses a force probe to collect data pertaining to the net torque exerted on the edge of the disk as a function of time, as shown in the graph. What feature of the graph will give you the change in angular momentum?
can't be found
the slope
the y-axis
the area

The graph above could be a representation of which two of the following situations? Select two answers.
Vertical position vs. time, as an object falls with no air resistance
Kinetic energy vs. time, as an object falls with no air resistance
Kinetic energy vs. time, as a rocket flies at constant speed but steadily burns fuel
Potential energy vs. time, as an object falls with no air resistance

The graph shows the force exerted on a ball by the floor as a function of time as the ball bounces off the floor. If the positive direction is upward, which of the following graphs could represent the force exerted on the floor by the ball?


A block is attached to the end of a string and initially moves at a constant speed in a horizontal circle of constant radius, as shown. The radius is then increased slowly while the speed remains the same. Which of the following graphs best represents the force exerted on the block by the string as a function of the radius?


Object A is released from rest at height h. At the same instant, Object B is thrown downward from the same location. Which of the following graphs of speed of v as a function of time t is correct for the two objects?


How would you linearize this data?
Graph y2 vs x
Graph y vs x2
Graph y vs. 1/x
Graph y2 vs x2

How would you linearize this data?
Graph y vs x2
Graph y2 vs x
Graph x vs y
Graph y2 vs x2
What is the name of this kind of relationship?
Open Top Parabola
Inverse
Linear
Side Opening Parabola
What equation do I use to find how fast an object must go to stay in orbit?


What equation do I use when I am looking for the acceleration due to gravity on a surface?


The number that I plug in G is_____
9.8
6.67x10^-11
there is no number for that equation

In this equation, X is your _______
distance stretched/compressed from equilibrium
distance stretched/compressed from any initial position
spring constant

What does F in this equation stand for?
perpendicular force
total force
parallel force

What are we looking for in this equation?
power
weight
width
time

