
 Worksheets
CVP Analysis
Total questions: 23
Worksheet time: 12mins
Which of the following is true about CVP analysis?
shows how profit will be affected by alternative sales volumes, selling prices and costs.
sometimes also called break-even analysis
is based on a simple profit calculation involving revenues and costs.
all of these are true about CVP analysis
Which of the following is true about fixed costs?
Constant in total for a specific time period.
Not affected by differences in volume during that same period.
Depicted by the horizontal straight line on a graph,
All of these are true about fixed costs
Variable costs...
Change in a time period in direct proportion to a change in volume.
Depicted by a sloping line on a graph,
Constant per unit of volume
Variable costs are all of these
What is the total costs equation?
Total costs = fixed costs + (variable costs per unit x sales volume)
Total costs = variable costs + (fixed costs per unit x sales volume)
Total costs = variable costs - (fixed costs per unit x sales volume)
Total costs = fixed costs - (variable costs per unit x sales volume)
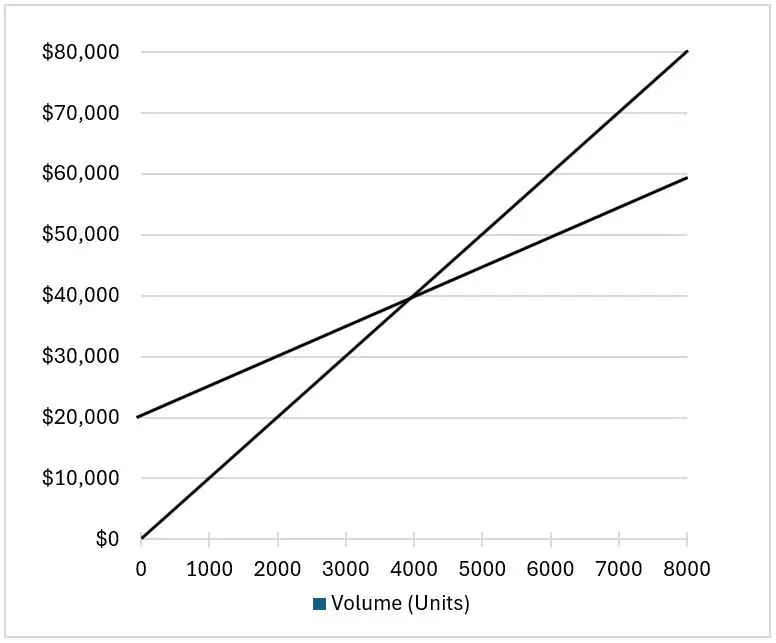
What is this graph called?
Profit graph
Contribution margin graph
Balance sheet graph
All of these are correct
How much are fixed costs?
$20,000
$40,000
$80,000
$60,000
How many units need to be sold to break even?
2,000
4,000
8,000
0
If the business sells 2000 units, how much profit will it make?
$10,000
$30,000
$20,000
None of these. It will make a loss
If the business sells 8000 units, how much profit will it make?
$10,000
$30,000
$20,000
None of these. It will make a loss
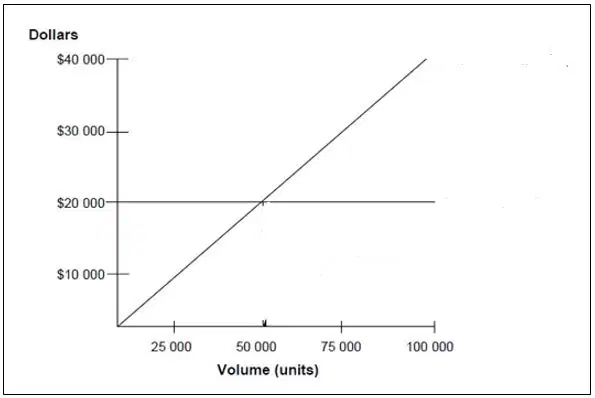
What best describes this type of graph?
Profit graph using the contribution margin
Fixed margin graph
Balance sheet graph
All of these are correct
How much are fixed costs?
$20,000
$40,000
50,000
None of these are correct
How much in sales are needed to break even?
$20,000
$40,000
50,000
None of these are correct
How many units need to be sold to break even?
25,000
40,000
50,000
20,000
How much profit will be made if the business sells 100,000 units?
$25,000
$40,000
$50,000
$20,000

Profit (for a given sales volume) =
SPx - VCx - FC
SPx + VCx + FC
SPx + VCx - FC
SPx - VCx - FCx
Contribution margin =
SP - VC
SP + FC
SP - FC
SP + VCx
Breakeven units =
FC ÷ CM
FC x CM
CM ÷ FC
SP + VCx
Breakeven sales =
FC ÷ CM x SP
FC x CM x SP
CM ÷ FC - SP
SP + VCx
Unit sales required to meet a desired profit level =
(FC + Desired profit) ÷ CM
FC x Desired Profit x CM
(FC - Desired profit) ÷ CM
FC - Desired profit - CM

How much is the contribution margin?
$26.40
$28.60
$55
$2376
How many units need to be sold to break even?
90
55
83
43
How many units need to be sold to make a profit of $5,000?
280
180
5000
2376
Besides the financial impact of decisions, what else should be considered?
What will be the impact on the environment?
What health effects might employees suffer later?
What might be the impact on society?
All of these should be considered

