
 Worksheets
Graphing
Total questions: 97
Worksheet time: 2hrs 56mins
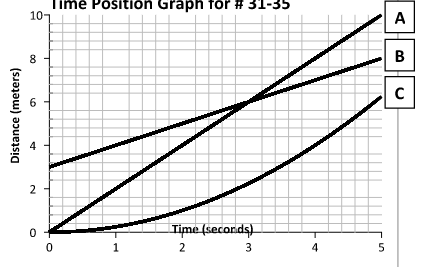
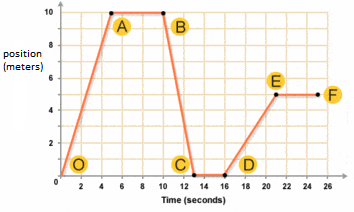
What is happening in this graph from point B to C?
The object is going down a hill.
The object is returning to its starting location.
The object is slowing down.
The object is staying still.


At which letter(s) is the slope negative?
a
b
c
d

At which letter(s) is the velocity zero?
A
B
C
D
Δ What does this sign mean?
proportional to
equal to
change in
therefore
The velocity-time graphs represent the motion of three different objects. Identify any object that is changing directions. Check all that apply.


None of the above
2 points
Identify which 2 objects are speeding up. SELECT BOTH GRAPHS!


Total distance an object travels with direction.
Displacement
Distance
Path
Velocity
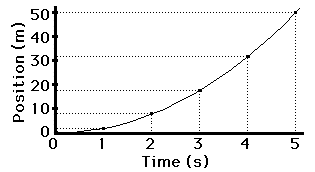
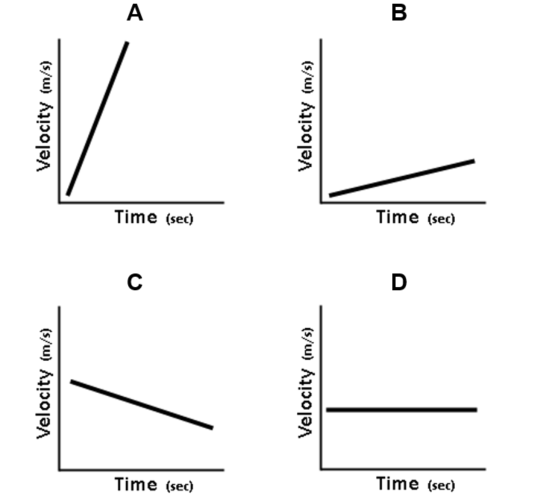
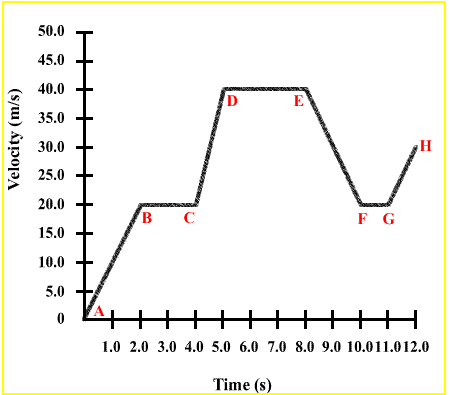
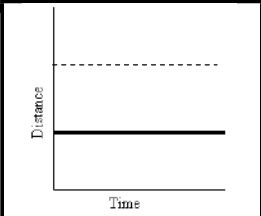
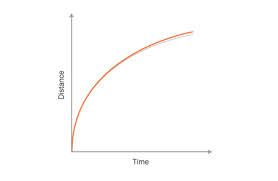
What is this graph showing?
Constant Speed
Acceleration (speeding up)
Negative Acceleration (slowing down)
No motion


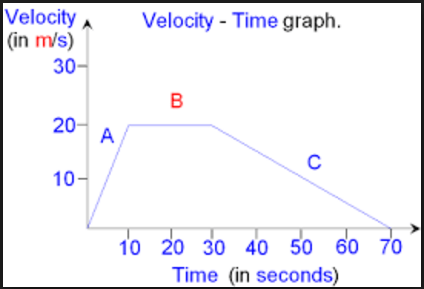



What is happening in section C?
going down a hill
speed is increasing
speed is decreasing

At which position is the object accelerating the fastest?
c
k
neither because they are slowing down, which isn't acceleration
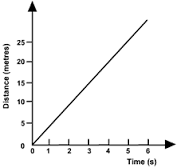

Describe the motion at position A and B.
A is slower than B
B is slower than A
A is the same as B
Cannot be determined
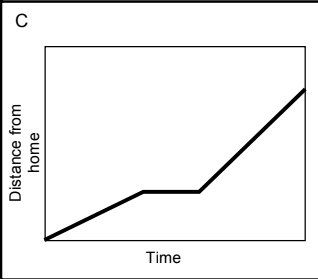
Choose the graph that matches the following scenario:
A student walked to his locker, stopped for a few seconds and then continued on the same path to class.


Choose the graph that matches the following scenario:
A student ran to the cafeteria, then stopped and looked around for his lunch kit, and then ran back to the class to get it.
Choose the graph that matches the following scenario:
A student walked at a steady, constant pace as she went from one class to the other.


Provided the position vs. time graph, which of the following is true?
the object increases its velocity
the object decreases its velocity
the object's velocity stays unchanged
the object is at rest

The graph represents the linear motion of a car. What is the acceleration of the car from the time t=5s to t=9s?
4m/s2
-3m/s2
-4 m/s2
-6m/s2
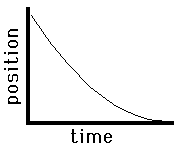
Describe the motion of the object.
Slow to fast; Negative direction
Fast to slow; Negative direction
Fast to slow; Positive direction
Slow to fast; Positive direction

The slope of this position vs time graph is...
Constant
Increasing
Decreasing
0

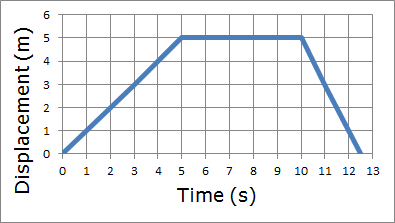
How long did one of the runners rest?
4 seconds
5 seconds
6 seconds
13 seconds

What is happening to the object according to this graph?
Nothing, it is not moving.
Constant positive velocity
Positive acceleration
Negative acceleration

What is happening to the object according to this graph?
Nothing, it is not moving.
Constant positive velocity
Positive acceleration
Negative acceleration

What is happening to the object according to this graph?
Nothing, it is not moving.
Constant positive velocity
Positive acceleration
Negative acceleration
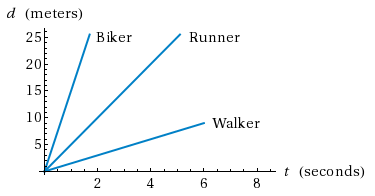
Which person moved the fastest in 3 seconds?
biker
runner
walker
they are all moving equally

What is the displacement of the object at 45 seconds?
7 m
13 m
.16 m
6.4 m

Describe the motion in the graph:
Constant Speed (positive slope)
Stopped (at rest)
Acceleration (increasing speed)
Return Home (negative slope)

Describe the motion in the graph:
Constant Speed (positive slope)
Stopped (at rest)
Acceleration (increasing speed)
Return Home (negative slope)
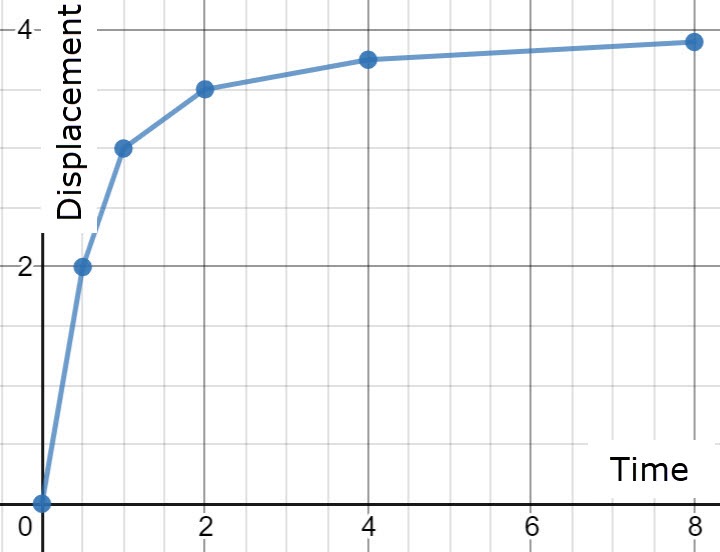
The speed of the object in this graphs is....
Slowing down
Moving towards me
Speeding up
Constant velocity
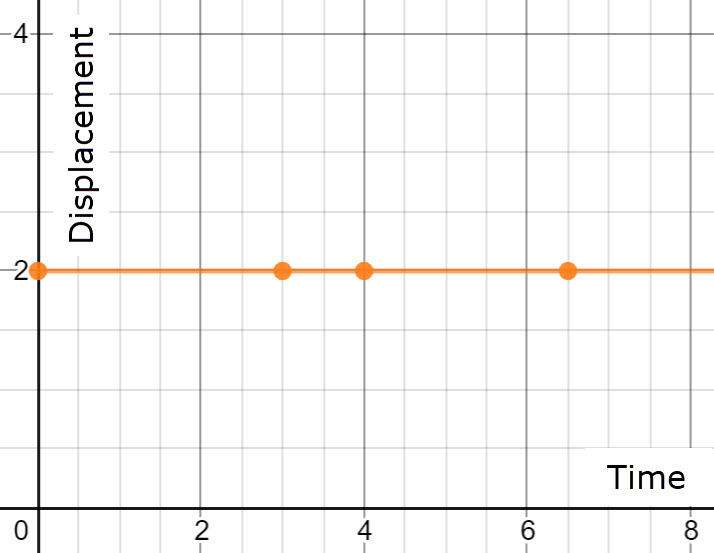
The speed of the object in this graphs is....
Stopped
Constant velocity
Positive velocity
Speeding up
Which of these position vs. time graphs shows an object changing direction?


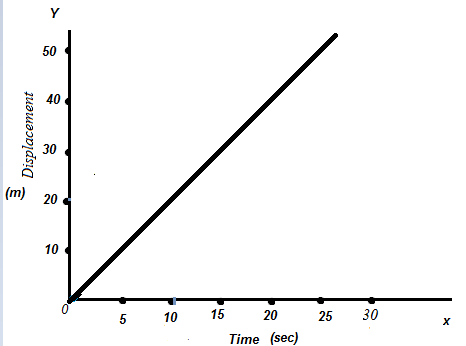
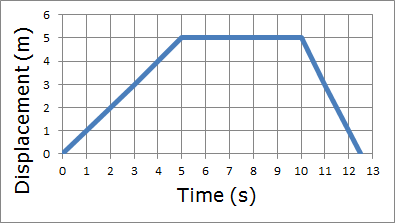
What is shown in this displacement vs time graph?
uniform velocity
uniform speed
no speed (at rest)
acceleration
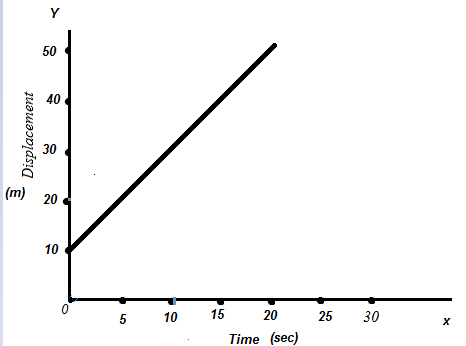
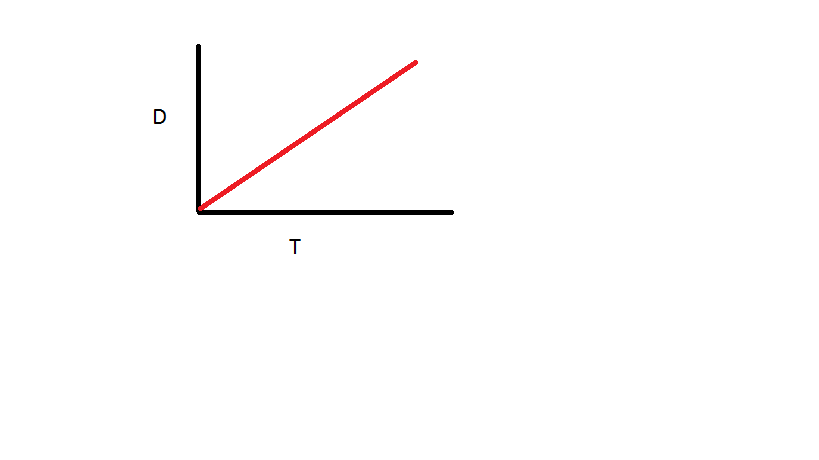
What is shown in this graph?
uniform velocity and initial displacement 10m
uniform velocity and initial velocity 10m
acceleration
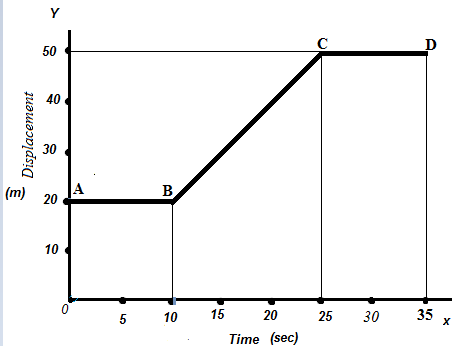
What is happening between B and C in this graph?
constant acceleration
uniform velocity
at rest
What is happening between C and D in this graph?
constant acceleration
uniform velocity
at rest
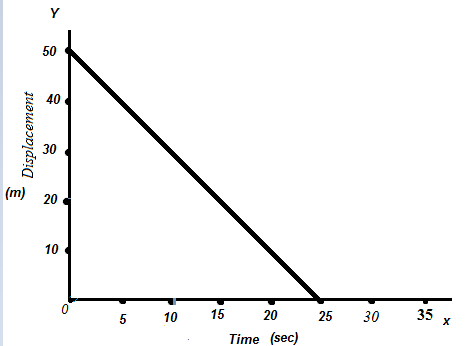
What is happening in this graph?
constant positive velocity
constant negative velocity
negative acceleration
gravity
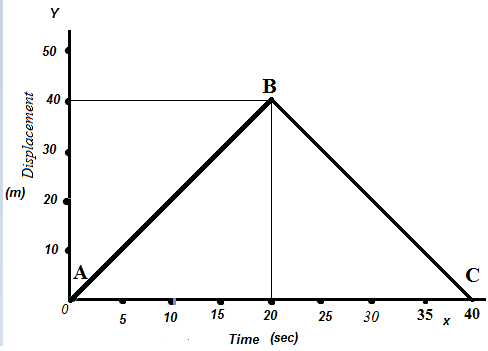
What is happening from B to C?
acceleration
uniform negative velocity
uniform acceleration
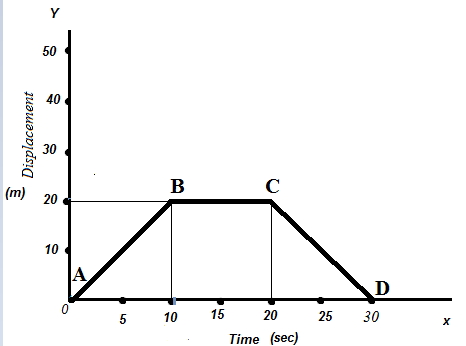
What is happening from A to B, from B to C and from C to D in the given graph?
A to B uniform positive velocity, B to C at rest, C to D uniform negative velocity
A to B positive acceleration, B to C no acceleration and C to D negative acceleration
A to B high speed, B to C low speed, C to D very low speed
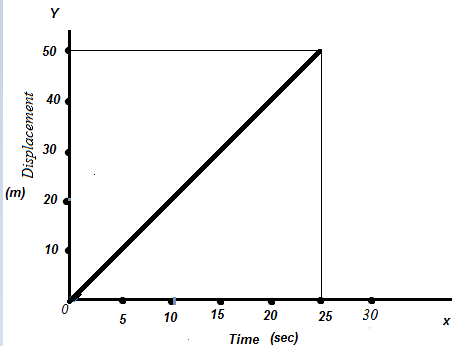
Find the velocity from the given graph.
2 m/s
21 m/s
100 m/s
-2m/s
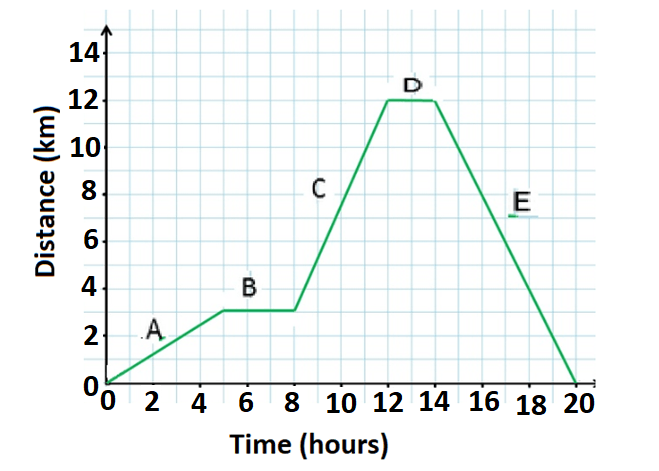
What is the displacement of this object at 13 hours?
.92 km
0 km
12 km
1.92 km
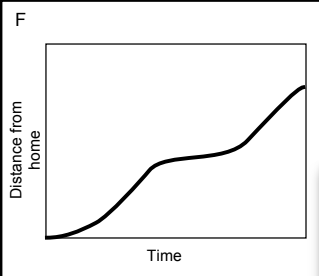
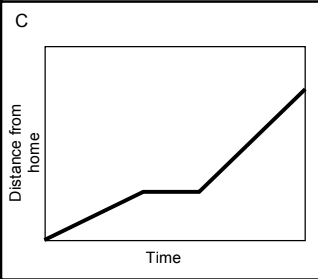
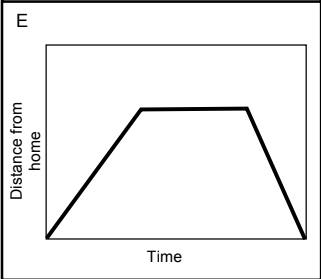
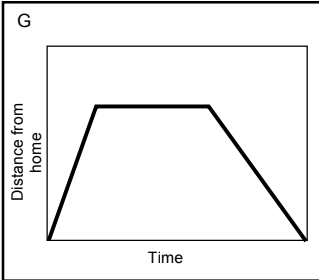
Deb walked to the ice cream shop. Sat and ate her ice cream and then went for a run.
Which graph matches this motion?
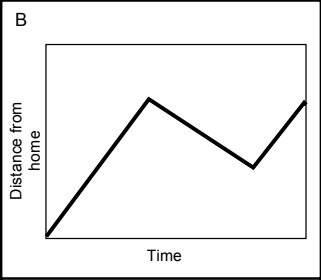
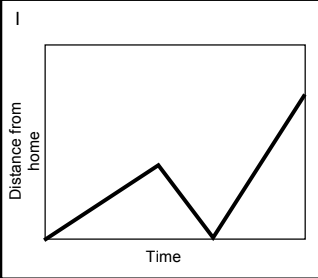
Susie went to the store, when she got there she realized that she forgot her wallet and returned home.
Which graph matches this motion?
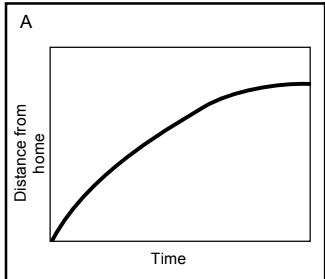

Which d(x)-t graph matches this v-t graph of an object moving away from the origin?


Which d (x)-t graph matches the v-t graph shown?


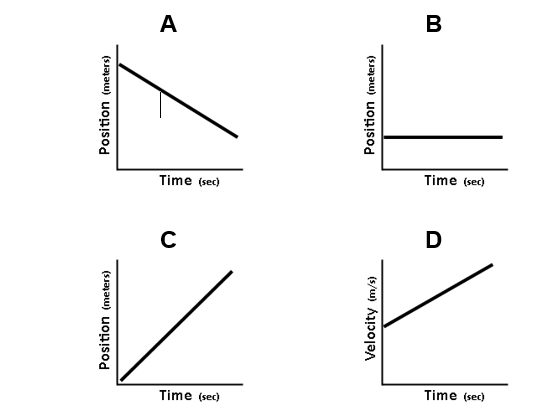

Which of the velocity vs. time graphs below goes with the position vs. time graph shown?


What is the average acceleration in the first ten seconds?
4 m/s2
1.5 m/s2
10 m/s2
0 m/s2
What is the acceleration at 25 s?
25 m/s2
1.0 m/s2
10 m/s2
0 m/s2

A, B, and D
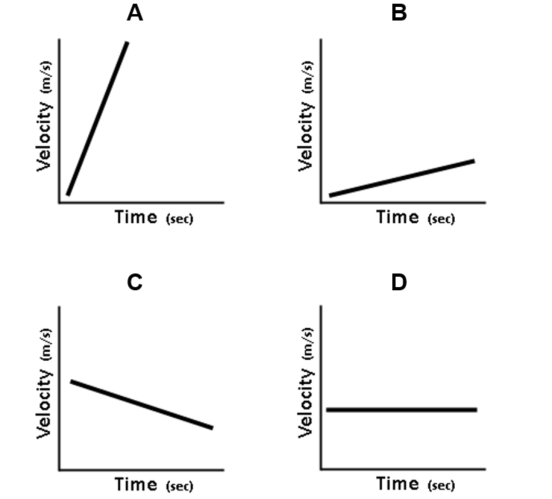


Which pair of graphs represent the correct relationship between displacement and the velocity of a moving object?
Pair A
Pair B
Pair C
Pair D

The graph below relates velocity to time. The graph would most likely apply to which of the following events?
A soccer ball that is at rest is suddenly kicked.
A ball is thrown upward and returns to the ground.
A person who is running at a constant speed decides to run faster.
A car traveling at a constant speed applies its brakes and comes to a stop.

The accompanying graph shows the velocity of a race car moving along a straight line as a function of time. What is the magnitude of the displacement of the car from t = 2.0 seconds to t = 4.0 seconds?
20 m
40 m
60 m
80 m

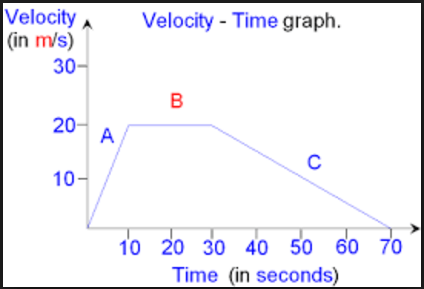
Calculate the displacement traveled in section B.
150 m
50 m
100 m
200 m
Calculate the displacement traveled in section A.
75m
50 m
100 m
125 m
150 m

What is the displacement from 0-10 seconds?
10 m
10 m
100 m
200 m
What is the acceleration during interval C?
0 m/s/s
-2 m/s/s
-1.33 m/s/s
-20 m/s/s
What is the acceleration during interval B?
0 m/s/s
2 m/s/s
10 m/s/s
20 m/s/s
What is the velocity at 12.5 seconds?
0 m/s
2 m/s
10 m/s
20 m/s

