
Font size
 Worksheets
Unit 0 Intro and Math Review Questions Complete
Total questions: 146
Worksheet time: 4hrs 53mins
What is the primary focus of Unit 0, Lesson 1 in the learning material?
Theories of Evolution
The Methods of Science
Chemical Reactions
Historical Discoveries
What does science aim to discover?
Nature's 'rules' about how things work
Supernatural phenomena
Fictional stories
Historical myths
Life science includes the study of which of the following?
Chemistry
Physics
Botany
Geology
Which branch of science is concerned with volcanoes?
Life science
Earth science
Physical science
Social science
In the scientific method, what question might you ask when gathering information?
What is the hypothesis?
Has someone already investigated this?
What is the conclusion?
How do I conduct the experiment?
What is an independent variable in an experiment?
What you measure
What you change on purpose
A constant factor
The result of the experiment.
What is a dependent variable in an experiment?
What you change on purpose
A constant factor
What you measure
The control.
In an experiment to test the effect of fertilizer, what would be the independent variable?
The amount of water
The type of plant
The amount of fertilizer
The growth of the plant.
Why is a control used in an experiment?
To change the outcome
To measure the dependent variable
To compare results
To alter the independent variable.
What is the role of the independent variable in an experiment?
It is the variable that is measured.
It is the variable that is changed.
It is the variable that remains constant.
It is the variable that is dependent.
In the statement 'The effect of sunlight on plant growth,' which is the dependent variable?
Sunlight
Plant growth
Soil type
Water amount
Which statement is true about the independent variable?
It is always the same as the dependent variable.
It is the variable that is manipulated.
It is the variable that is measured.
It is the variable that is kept constant.
What is the purpose of organizing data into charts or graphs?
To make it look colorful
To make it readable by others
To hide the data
To confuse the reader.
What is the definition of technology?
The application of science to help people
A type of computer
A form of art
A natural phenomenon.
Technology is often thought of as things like computers, but it also includes things like: A) Velcro B) Water C) Air D) Soil.
Velcro
Water
Air
Soil
Life science deals with which of these categories?
history
art
biology
chemistry
which of the following is NOT part of the three major categories of science
biology
chemistry
physics
dance
Does you experiment have to be repeatable?
yes
no
what is an independent variable?
the variable that is changed to test the effect on the dependent variable
a factor that does not change
the variable that changes
something that doesnt change
what is an example of a control?
something that is a standard by which the test results can be compared
a change
something that depends on something else
none of the above
Is a hypothesis a scientific theory?
Yes
NO
what is a scientific law?
a guess
hypothesis
an explanation of things or events based on knowledge gained from many observations and investigations
a statement about what happens in nature and that seems to be true all the time
What is the independent variable in the following scenario?
"The blood pressure of a soldier is measured while he is resting. The soldier is then exposed to a stressful environment and his blood pressure is measured again."
the environment
the soldier
blood pressure
none of the above
What is the dependent variable in the following scenario?
"The blood pressure of a soldier is measured while he is resting. The soldier is then exposed to a stressful environment and his blood pressure is measured again."
the environment
the soldier
blood pressure
none of the above
Which of the following statements about hypotheses is true?
Hypotheses can never be changed.
Hypotheses are always proven to be true.
Hypotheses can be accepted or rejected.
Hypotheses can be proven true without evidence.
The information gathered from making observations is called ____.
experiment
graph
procedure
What is a possible answer or explanation to a question based on knowledge, observations, and research?
HINT: It is often written in "if...then" format.
Observation
Hypothesis
Experiment
Conclusion
A group of people decide to find out if eating apples reduces the number of colds a person will catch. What is the dependent variable?
The number of apples the test subjects eat
The number of colds the test subjects catch
The subjects who do NOT eat apples
The average age of the test subjects
A group of people decide to find out if eating apples reduces the number of colds a person will catch. What is the independent variable?
The number of apples the test subjects eat
The number of colds the test subjects catch
The subjects who do NOT eat apples
The average age of the test subjects
Expresses any number as a number between 1 and 10 (known as a coefficient) multiplied by 10 raised to a power (known as an exponent). Makes it easier to write large or small quantities.
metric system
scientific notation
standard notation
dimensional analysis
How would you write 7.6 x 10⁻⁴ in standard form
76000
760000
0.00076
7.6
Express the following in Scientific notation:
57800
5.78 x 10⁴
57.8 x 10⁵
5.78 x 10⁵
578

The average distance from Earth to the Moon is 384,400 km (238,900 miles). In Scientific Notation this is represented as:
384.4 x 10³ km
38.44 x 10⁴ km
3.844 x 10⁵ km
All of the above.
How do you write 567.8 in scientific notation?
5.678 X 10²
5.678 X 10⁻²
5678 10−1 X
5678 X 101
How do you write 0.0034 in scientific notation?
34 X 10−4
34 X 104
3.4 X 10⁻³
3.4 X 10³

Write 3450. meters in scientific notation
3.45 x 10³ meters
34.5 x 10² meters
345 x 101 meters
0.345 x 10⁴
What is 0.00534 millimeters written in scientific notation?
0.534 x 10⁻³ millimeters
5.34 x 10⁻³ millimeters
53.4 x 10⁻⁴ millimeters
534 x 10-5 millimeters
What is 0.00534 millimeters written in scientific notation?
0.534 x 10⁻³ millimeters
5.34 x 10⁻³ millimeters
53.4 x 10⁻⁴ millimeters
534 x 10-5 millimeters
1.24 centimeters written in scientific notation will become
1.24 x 100 centimeters
1.24 x 101 centimeters
0.124 x 101 centimeters
124 x 102 centimeters
When you move the decimal point to the LEFT, the exponent _________________________
goes up
goes down
stays the same
When you move the decimal point to the RIGHT, the exponent
goes down
goes up
stays the same
When multiplying two numbers in scientific notation, what do you do with the exponents?
Add them
Subtract them
Multiply them
Leave them alone
When subtracting two numbers in scientific notation, what do you do with the exponent?
Leave them alone
Leave them alone (But only if they match)
Subtract them
Add them
When dividing two numbers in scientific notation, what do you do with the exponents?
Add them
Subtract them
Multiply them
Leave them alone
Complete the operation:
(6 x 10^5) X (1 x 10^10)
7 x 10^15
6 x 10^-5
6 x 10^15
6 x 10^50
Complete the operation:
(4 x 10^3) + (8 x 10^3)
1.2 x 10^4
1.2 x 10^3
12 x 10^3
12 x 10^4
Complete the operation:
(8 x 10^-3) / (4 x 10^-8)
2 x 10^-11
2 x 10^-5
2 x 10^5
2 x 10^11
Simplify:
105⋅107
1035
10012
1012
None of the above
Simplify:
(6x2)(−3x5)
18x7
−18x7
3x7
None of the above
What is a 'standard' in the context of measurements?
A random guess
An exact quantity agreed upon for comparison
A personal opinion
A flexible guideline
What is a 'pace' in historical measurement terms?
The length of a person's arm
The length of a person's step
The width of a person's hand
The height of a person's knee.
What is the main problem with using body parts as measuring devices?
They are not standardized
They are too expensive
They are too heavy
They are too small
What unit would you use for buying potatoes?
pound
miles
foot
yard
gallon
Which of the following is a unit of volume in the English system?
gallon
pound
foot
yard
Match the following metric system units: A 2 ______ bottle of soda.
gram
liter
meter
Match the following metric system units: A ________ stick.
gram
liter
meter
Which of the following is a unit of length in the SI system?
Inch
Meter
Foot
Yard
Which of the following is a unit of length in the SI system?
Centimeter
Inch
Foot
Yard
How many centimeters are there in one meter?
10
50
100
1000
What do the large numbers on the meter stick represent?
Millimeters
Centimeters
Meters
Inches
Which of the following is a characteristic of the metric system?
Base 2
Base 5
Base 10
Base 12
What is the relationship between millimeters and centimeters?
1 mm = 10 cm
10 mm = 1 cm
100 mm = 1 cm
1000 mm = 1 cm
How many millimeters are there in 1 centimeter?
10 mm
100 mm
1 mm
1000 mm
What does weight measure?
Mass + gravity
Volume + density
Energy + force
Length + width
What is a "cc"?
Select all that are correct
an ounce
a cubic centimeter
a mL
a common curreny


1 cup = 16 Tbsp
1 Tbsp = 3 tsp
1 mL = 0.2 tsp
How many mL are in 1.0 cup?
240 mL
9.6 mL
1.1 mL
27 mL
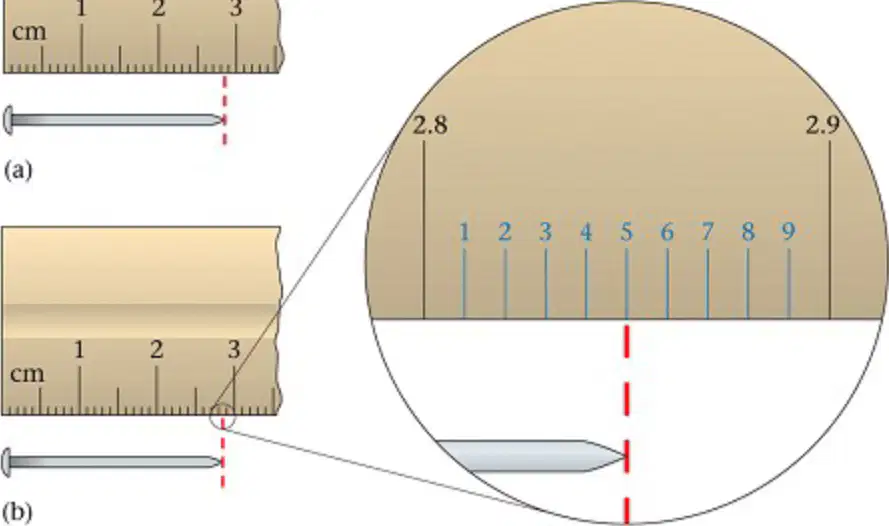
According to the image, what does every measurement have?
Exactness
Some degree of uncertainty
No error
Absolute precision
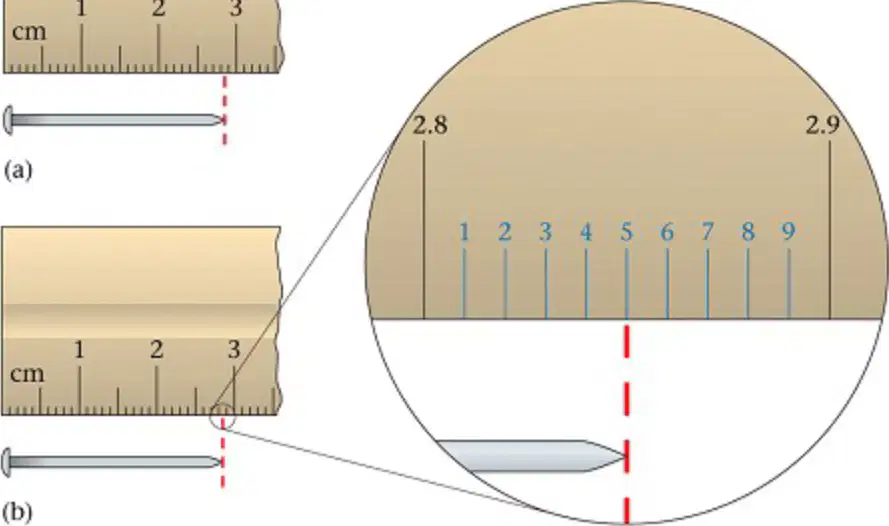
In the image, what is being measured?
A piece of wood
A nail
A screw
A bolt
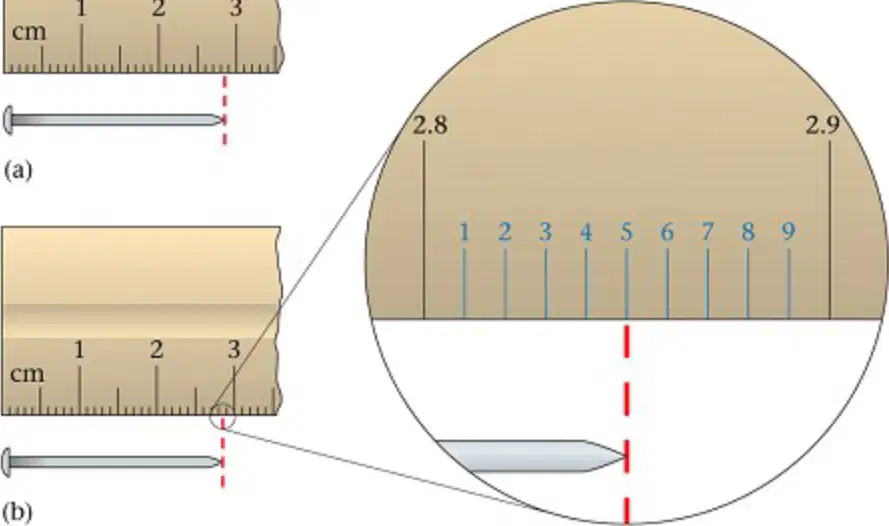
What is the approximate length of the nail as shown in the image?
2.5 cm
3.0 cm
2.8 cm
3.5 cm
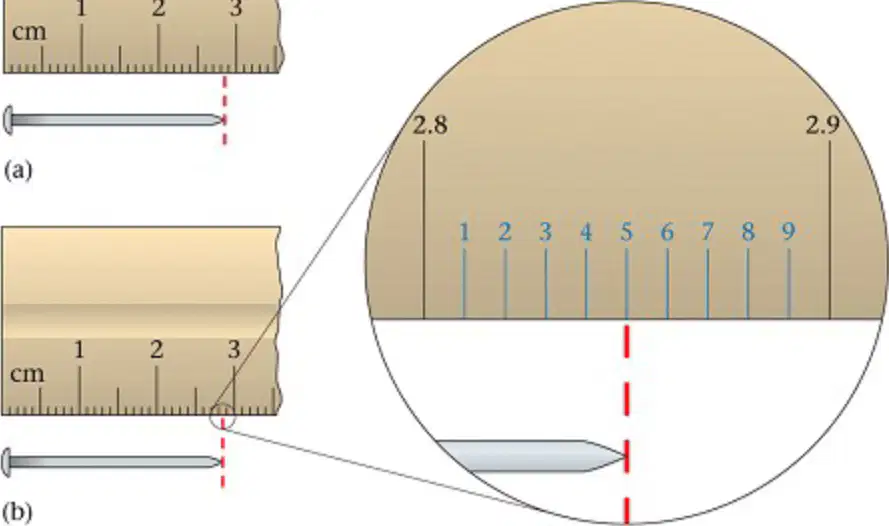
Why is there a red dashed line in the image?
To indicate the start of the measurement
To show the end of the nail
To highlight the measurement uncertainty
To mark the ruler's zero point.
What are significant figures in a measurement?
A) All certain numbers plus the first estimated number
B) Only the estimated numbers
C) Only the certain numbers
D) None of the above.
Which of the following is true about precision and accuracy?
Measurements can be precise but not accurate
Measurements can be accurate but not precise
Both A and B
Neither A nor B
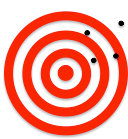
What is an example of precision in measurement?
A) Grouping darts closely together
B) Hitting the bull's-eye on a dart board
C) Counting significant figures
D) None of the above.
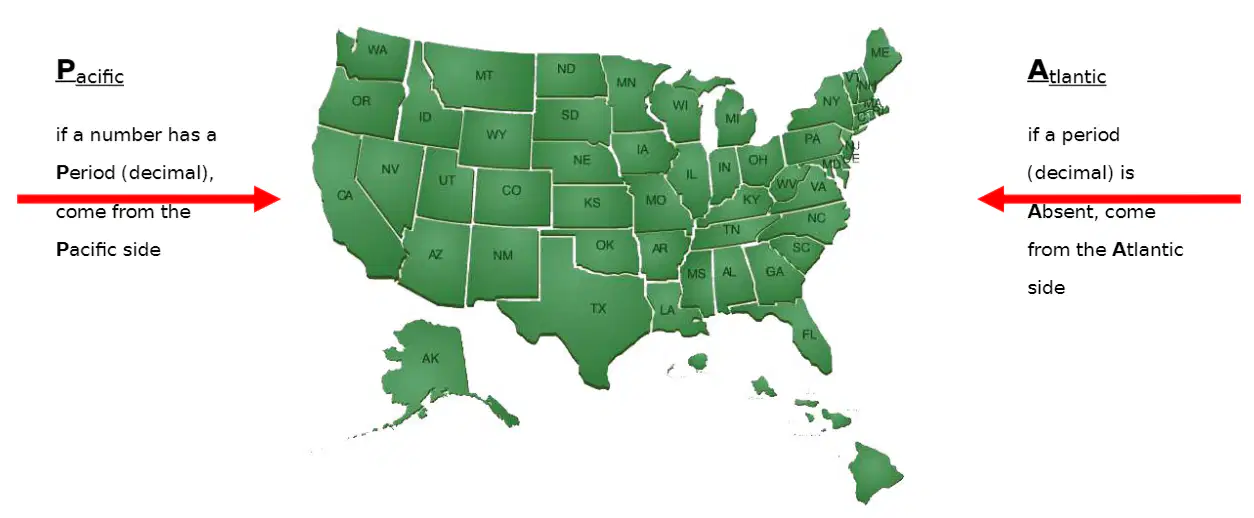
Which side is associated with the presence of a decimal point in the rules for counting significant figures?
Pacific
Atlantic
Both
Neither
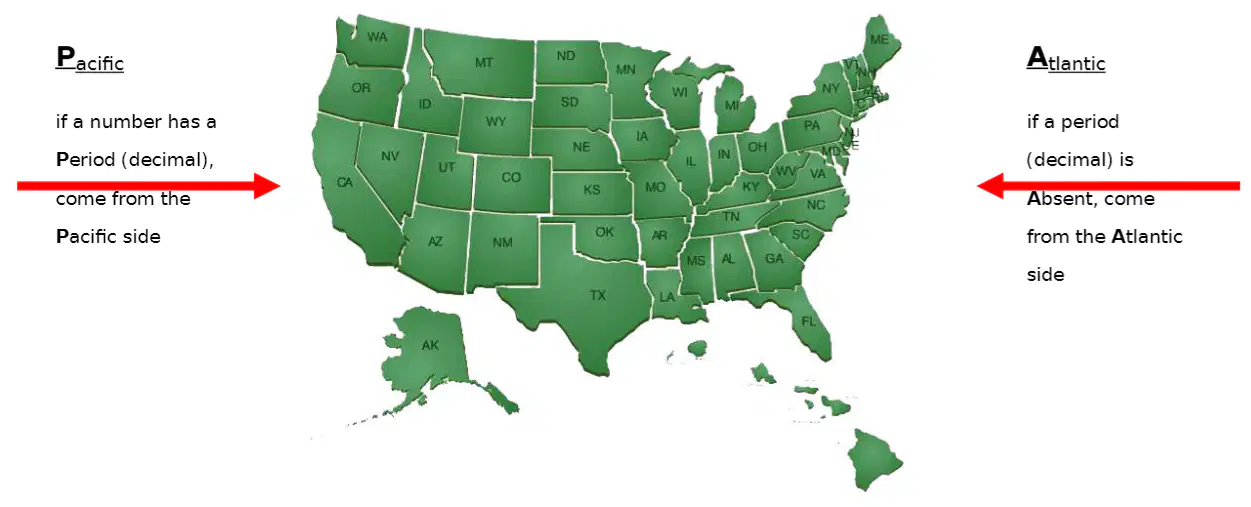
According to the simple method, if a period (decimal) is absent, which side should you come from?
Pacific
Atlantic
Both
Neither
How many significant figures are in the number 100.?
A) 1
B) 2
C) 3
D) 4
How many significant figures are in the number 100.80?
3
4
5
6
What is the rule for counting leading zeros in significant figures?
Always count
Never count
Count only if there's a decimal point
Count if followed by a non-zero digit.
How many significant figures are in the number 100?
A) 1
B) 2
C) 3
D) 4
In the number 1.008, which zeros are considered captive zeros?
A) The first zero
B) The last zero
C) All zeros
D) None
0.0097 has how many sig figs?
2
3
4
5
How many sig figs are in 1010?
1
2
3
4
Identify the number of sig figs in 0.0810
2
3
4
5
12.03 + 43.5 = ?
Express your answer to the correct place value.
55.530
55.53
55.5
56
7.80÷0.091= ? Round your answer to the correct number of sig figs.
85.71429
85.71
85.7
86

Which is the more precise measurement?
4 mL
4.3 mL
4.30 mL
4.300 mL
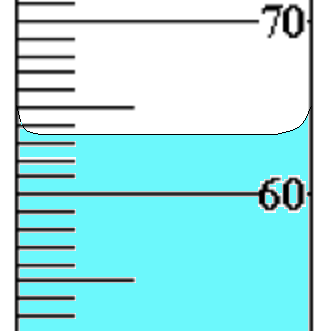
24.567 + 0.04478 =
705000
How many significant figures should your answer have for the following multiplication problem 19.10 X 18.0 X 22
2
4
3
none

What is the length of the object in centimeters?
3.40 cm
4.3 cm
3.5 cm
1 1/4 inches


The variable that is measured. It goes on the y-axis.
Independent Variable
Dependent Variable



How many push ups were done on Friday?
0
20
5
10

How many more potatoes were grown in 2011 than in 2009?
5
10
15
20

Which cereal received the least amount of votes?
Corn Flakes
Cheerios
Life
Kix

The data table below shows that as the pressure of a gas sample was changed, the volume of the gas changed. The pressure was measured in atmospheres (atm) and the volume was measured in milliliters (mL).
According to the data table, as the pressure of the gas increases, the volume of the gas:
decreases
increases
remains the same

How many more average daily calories are needed by a 17 year old male than by a 17 year old female?
300
500
2700
3000

What is the difference between the number of frogs in the pond when the rainfall was 5cm and when the rainfall was 20cm?
20
40
50
60

Which is correct?
Sales of food and drink... from Monday to Friday.

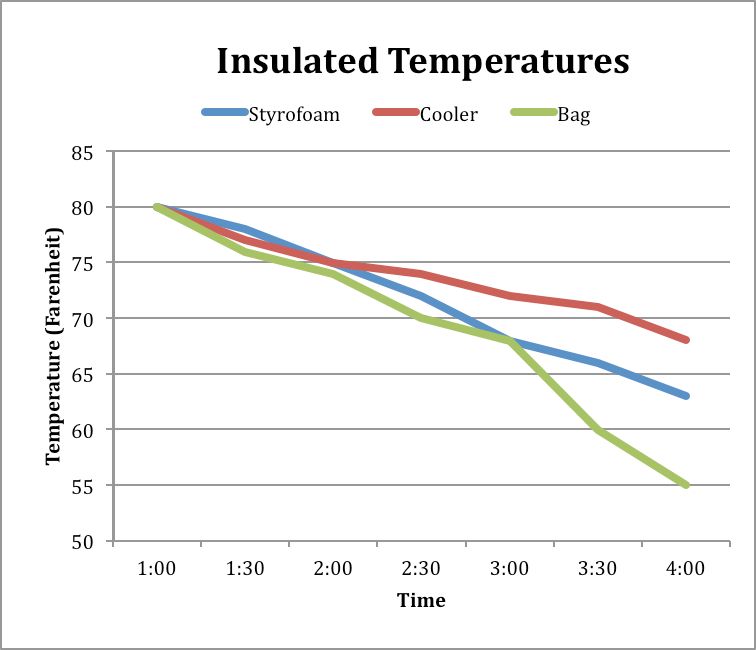
What data does this graph represent?
Change in temperature of a liquid over time in 3 different containers
How temperature can change the molecules in a material
The phase changes of a material
What type of container people use the most to store hot liquids.

Which type of container keeps liquid the hottest for the longest time?
Bag
Cooler
Cooler and bag are tied
Styrofoam

What conclusions can you draw from this graph?
The deer population went down over time.
The deer population went up over time.
The dear population went up quickly, then down, but then stayed the same.
There are less dear because of hunters
You want to make a graph for an experiment you did about plant growth over a two week period of time. What type of graph would you use?
bar graph
line graph
pictograph
pie chart


What information is NOT shown in this diagram of the solar system?
the names of planets
the order of the planets
the path the planets travel in their orbit
the distance between the planets

What information could you get from this graph?
how much water is on Earth
the percentage of the earth that is covered in water
how land is available on earth
how tall the highest mountain is

In this graph, scientists counted how many seeds were made by a fruit depending on how the flower was pollinated. (Self pollinated, by a bee or by the farmer/manual) What is the CONTROL/constant variable?
The number of seeds
The type of fruit
How the flower was pollinated (self, bee, manual)
The MANIPULATED/Independent variable is:
The item the scientist or "I" am testing in the experiment
The item that is changing BECAUSE of the experiment
The item(s) that have to stay the same or constant in the experiment
The RESPONDING/dependent variable is:
The item the scientist or "I" am testing in the experiment
The item that is changing BECAUSE of the experiment
The item(s) that have to stay the same or constant in the experiment

A seventh grade science class has been working for two months on an intensive plant lab in the garden, experimenting with growing greens under plastic coverings and under cloth coverings to find out which material better protects plant growth in the winter. Cress is a type of edible plant. Their data is shown in this graph.
What is the X axis for this graph?
Length in cm
Weeks
Cress Growth
Plastic/Cloth


Identify the table:
Direct, Inverse, Neither
Direct
Inverse
Neither

Identify the table:
Direct, Inverse, Or neither?
Direct
Inverse
I don't know

What type of variation does this graph represent?
Direct
Inverse
Neither
What is the difference between a line graph and a bar graph?
A line graph displays data in a continuous manner, while a bar graph displays data in discrete categories.
A line graph is more suitable for showing trends over time, while a bar graph is more suitable for comparing data at a specific point in time.
A line graph is used to show the relationship between two variables, while a bar graph is used to compare multiple variables.
A line graph shows the trend over time, while a bar graph compares different categories.
What is the purpose of creating a line graph in science?
To display discrete data points
To visually represent the relationship between two variables over time or continuous data.
To compare data from different experiments
To show the distribution of data
How do you choose the scale for the x-axis and y-axis on a line graph?
Consider the range of values and choose a scale that accurately represents the data.
Select a scale that is unrelated to the range of values.
Use a scale that exaggerates the differences between data points.
Choose a scale that evenly divides the range of values.
What are some common mistakes to avoid when creating a line graph?
Using too many colors, not using a grid, not including a legend, and not using a consistent line style.
Not labeling the axes, using inconsistent scales, not including a title or key, and not plotting the data accurately.
How can you use a line graph to make predictions or draw conclusions?
By looking at the colors used in the graph.
By analyzing the trend, direction, and slope of the line on the graph.
By counting the number of data points on the graph.
By measuring the length of the x-axis on the graph.

Students collected trash on a beach over a one-year period and organized the data in the table below.
Which graph is best to display the data shown in the table?


What is the independent variable?
atomic number
electron volts
first ionization energy
Jim Askew's Graph

What is the dependent variable?
nicest fruit
number of people
types of fruit

