
 Worksheets
FM015 PART A SET 3
Total questions: 11
Worksheet time: 6mins
Name
Class
Date
1.

1. Which of the following statements relating to management information are true?All manufacturing company has four types of cost (identified as T1, T2, T3 and T4). The total cost for each type at two production levels is:
a)
T1 and T3
b)
T1 and T4
c)
T2 and T3
d)
T2 and T4
2.

3. The following production and total cost information relates to a single product organisation for the last three months:
(a)
3.

4. Which one of the above graphs illustrates a semi-variable cost – when the vertical axis represents cost incurred?
a)
Graph 1
b)
Graph 2
c)
Graph 3
d)
Graph 4
4.

5. The following is an extract from a spreadsheet:
a)
=D2 – D3
b)
=B6 + C6
c)
=D2 X D5
d)
=D4 – D5
5.

6. The cost of materials for product A are as follows,2 points
(a)
6.

7. When gathering information, you would use both internal sources of information and external sources of information.
a)
2 only
b)
2, 3 and 4
c)
1, 3 and 4
d)
All the above
7.

8. When communicating written information, which of the following determines the choice of method?
a)
1 only
b)
3 only
c)
1 and 2
d)
1, 2 and 3
8.
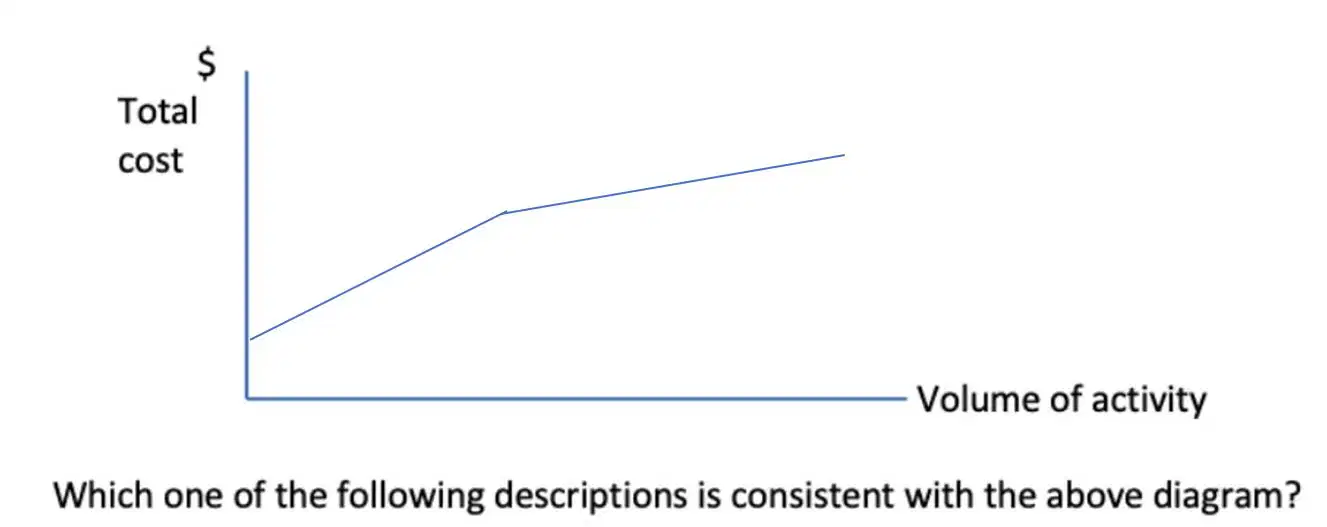
9. The following diagram represents the behaviour of one element of cost:
a)
Annual total cost of telephone services where the supplier makes a fixed charge and then a constant unit rate for calls up to a certain level. This rate then reduces for all calls above this level.
b)
Total annual direct material cost where the supplier charges a constant amount per unit which then reduces to a lower amount per unit after a certain level of purchases.
c)
Total annual direct material cost where the supplier charges a constant amount per unit but when purchases exceed a certain level a lower amount per unit applies to all purchases in the year.
d)
Annual total cost of factory power where the supplier sets a tariff based on a fixed charge plus a constant unit cost for consumption which is subject to a maximum annual charge.
9.
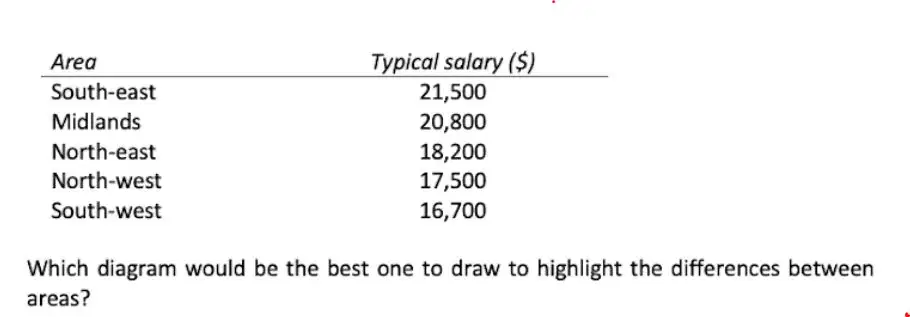
10. The following table shows that the typical salary of part qualified accountants in five different regions of England.
a)
A pie diagram
b)
A simple bar chart
c)
A multiple bar chart
d)
A percentage component bar chart
10.
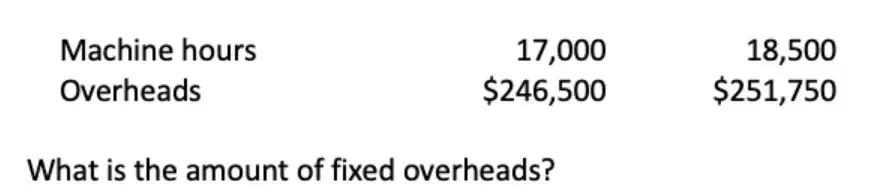
11. The following data relate to two output levels of a department:
(a)
11.
12. Which of the following best describes information?
a)
Data that consists of facts and statistics before they have been processed
b)
Data that consists of numbers, letters, symbols, events and transactions which have been recorded but not yet processed into a form that suitable for making decisions
c)
Facts that have been summarized but not yet processed into a form that is suitable for making decisions
d)
Data that has been processed in such a way that it has a meaning to the person who receives it, who may then use it to improve the quality of decision making
100 %

