
 Worksheets
FM015 PART B SET 2
Total questions: 13
Worksheet time: 7mins
Name
Class
Date
1.

1. The following information for advertising and sales revenue has been established over the past six months:
a)
Sales revenue = 62,500 + (25 x advertising expenditure)
b)
Advertising expenditure = -2,500 + (0.04 x sales revenue)
c)
Sales revenue = 95,000 + (20 x advertising expenditure)
d)
Advertising expenditure = -4,750 + (0.05 sales revenue)
2.
2. A company's weekly costs ($C) were plotted against production level (P) for the last 50 weeks and a regression line calculated to be C = 1,000 +250P. Which statement about the breakdown of weekly costs is true?
a)
Weekly fixed costs are $1,000, variable costs per unit are $5
b)
Weekly fixed costs are $250, variable costs per unit are $1000
c)
Weekly fixed costs are $1,000, variable costs per unit are $250
d)
Weekly fixed costs are $20, variable costs per unit are $5
3.
3. If a forecasting model based on total cost = fixed cost + variable costs is graphed, the equation is C = F+Vx and the intercept is $7,788. Total costs are $14,520 and x is 3,300.What is the value of the slope, to two decimal places?
(a)
4.
4. The correlation coefficient (r) for measuring the connection between two variables (x and y) and has been calculated as 0.6. How much of the variation in the dependent variable (y) is explained by the variation in the independent variable (x)?
a)
36%
b)
40%
c)
60%
d)
64%
5.

5. A company uses regression analysis to establish its selling overhead costs for budgeting purposes. The data used for the analysis is as follows:
a)
27,360
b)
39,960
c)
41,000
d)
56,760
6.

6. Which of the following are correct with regard to regression analysis?
a)
(i) and (ii) only
b)
(i) and (iii) only
c)
(ii) and (iii) only
d)
(i), (ii) and (iii)
7.

7. Regression analysis is being used to find the line of best fit (y = a + bx) from eleven pairs of data. The calculations have produced the following information:
(a)
8.

8. An organisation is using linear regression analysis to establish an equation that shows a relationship between advertising expenditure and sales revenue. It will then use the equation to predict sales revenue for given levels of advertising expenditure. Data for the last five periods are as follows:
a)
A
b)
B
c)
C
d)
D
9.
9. The coefficient of determination (r²) has been calculated as 60%.What does this mean?
a)
60% of the variation in the dependent variable (y) is explained by the variation in the independent variable (x)
b)
40% of the variation in the dependent variable (y) is explained by the variation in the independent variable (x)
c)
60% of the variation in the dependent variable (x) is explained by the variation in the independent variable (y)
d)
40% of the variation in the dependent variable (x) is explained by the variation in the independent variable (y)
10.
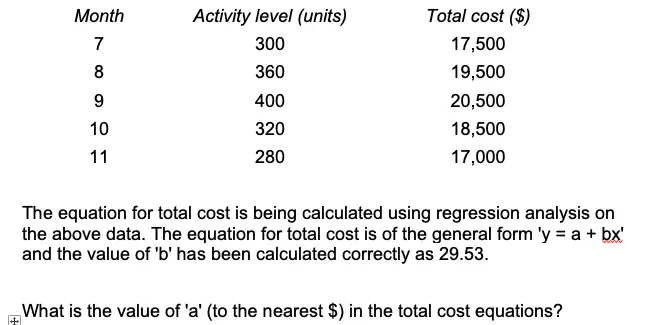
10. A company has recorded its total cost for different levels of activity over the last five months as follows:
a)
7,338
b)
8,796
c)
10,430
d)
10,995
11.

11. Further analysis has shown that there is a price index applicable to the overhead costs:
(a)
12.
12. The sales volume trend is to be identified using a 5-point moving average.What is the monthly trend?
a)
50 units
b)
500 units
c)
5,000 units
d)
50,000 units
13.
13. What is the expected sales volume including seasonal variation for December 20X1?
a)
206,040 units
b)
211,040 units
c)
222,480 units
d)
199,600 units
100 %

