
 Worksheets
PSY613 Quiz 12
Total questions: 11
Worksheet time: 3hrs 35mins
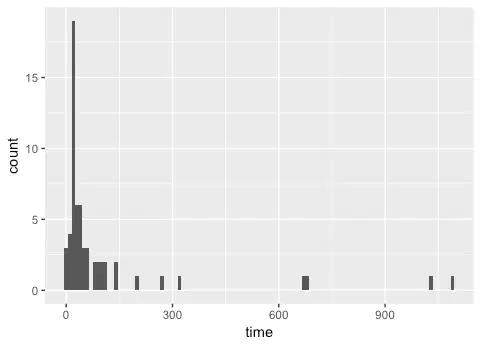
1. Below is a histogram of the time (in minutes) it took 61 students in PSYCH 613 to complete Quiz 11 (binwidth = 10).
TRUE
FALSE
2. Continuing the example from #1, the standard deviation of the time it took 61 PSYCH 613 students to complete Quiz 11 is 217.35 minutes. What is the standard error?
27.83
28.26
27.60
28.83
3. What is the best definition of statistical significance?
Assuming that the null hypothesis is true and the study is repeated an infinite number of times by drawing random samples from the same population(s), less than (usually) 5% of these results will be more extreme than the current result
A standard for deciding whether an observed result is because of chance
A very small chance (usually less than 5%) of finding a given test statistic if the null hypothesis is true
The confidence level of concluding that a given test statistic is due to chance or random error
4. You are interested in the kinds of smells people perceive to be disgusting. You conducted a correlational study in which participants smelled a reasonably diverse set of stimuli (e.g., rotten foods, poop, and old cigarette smoke) and then after each smell reported how disgusted they felt on a scale from 0 (not at all disgusted) to 6 (extremely disgusted). After all the data were collected, you realized there may be age group differences in self-reported disgust. As an initial test, you picked a smell at random—rotten eggs—and tested whether younger adults and older adults reported different levels of disgust after they smelled that stimulus. When you did this using the defaults in SPSS, which assume equal variances, you found that there was a significant age group difference (p = .01). However, when you did this using the defaults in R, which assume unequal variances and correct using the Welch test, you found there was NOT a significant age group difference (p = .06). When you looked more closely at your data, which you should have done before running the analysis, it turned out that older adults had greater variation in their reports of disgust than did younger adults. Why did the Welch test result in a larger p-value for the same data?
It adjusted the mean difference.
It reduced the degrees of freedom.
It increased the degrees of freedom.
It converted the difference to a z-score.
5. All other things being equal (e.g., sample size), what is true of an independent study design compared to a dependent study design?
It has less power to detect an effect (if one exists).
It has more power to detect an effect (if one exists).
It has the same power to detect an effect, but the data are collected differently.
It has the same power to detect an effect, but the test assumptions are different.
6. You read the excerpt below in a published article:
“The results of a 2 x 2 analysis of variance (ANOVA) on alcohol use revealed a significant main effect for treatment, F(1, 54) = 4.38, p = .017, partial η2 = .70, no significant main effect for gender, F(1, 54) = 0.39, p = .535, partial η2 = .14, and a significant treatment x gender interaction, F(1, 54) = 35.70, p < .001, partial η2 = .57.”
What can you conclude from this?
The difference in alcohol use between men and women in one treatment condition was different than the difference in alcohol use between men and women in the other treatment condition.
Men reported greater alcohol use than women.
The partial η2 calculations are incorrect because their sum is greater than 1.
Post-hoc tests are needed to interpret the direction of the significant effect of treatment.
7. TRUE or FALSE? In a one-way ANOVA, k - 1 non-orthogonal contrasts can perfectly decompose the variation in SSB, where k is the number of levels of the independent variable.
TRUE
FALSE

8. How much variance between two variables has been explained if their correlation is .60, as depicted below?
48%
12%
60%
36%
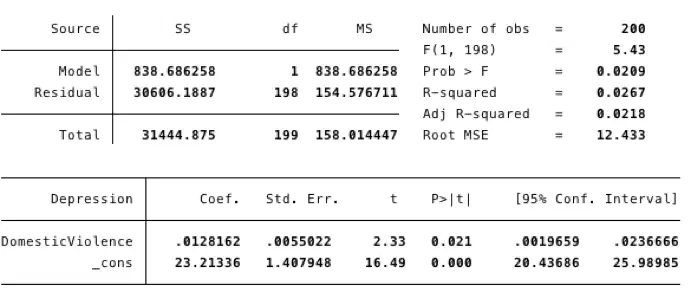
9. You are interested in examining the relationship between the amount of domestic violence that individuals experienced over the past year and their total current depressive symptoms. You ran a simple regression examining domestic violence as a predictor of depressive symptoms, and your output is below.
Which of the following is the best and most complete way to report the results?
Total amount of domestic violence experienced over the past year significantly causes greater current total depressive symptoms, F(1, 198) = 5.43, p = .021, R2 = .03, such that the more domestic violence exposure reported the greater amount of depressive symptoms currently being experienced, b = .01, p = .021.
Total amount of domestic violence experienced over the past year is related to current total depressive symptoms, F(1, 198) = 5.43, p = .021, R2 = .03, such that the more domestic violence exposure reported the greater amount of depressive symptoms currently being experienced, b = .01, p = .021
Total amount of domestic violence experienced over the past year is related to current total depressive symptoms, F(1, 198) = 5.43, p = .021, R2 = .03.
Total amount of domestic violence experienced over the past year is related to current total depressive symptoms, F(1, 198) = 5.43, p = .021, R2 = .03, such that the more domestic violence exposure reported the greater amount of depressive symptoms currently being experienced, b = 23.21, p < .001.

10. You introduce the first music app just for bugs - Spotifly. You want to determine the factors that affect the number of months your customers stay subscribed to your service, and you have a number of possible predictors you would like to test in a multiple regression. Below are your results.
What conclusions can you make from this output?
Adding the extra three predictors in Step 2 did not explain more of the variance than in Step 1.
Both the user's number of legs and the user's number of wings significantly predicted the months they subscribed to Spotifly.
Users' incomes had the highest standardized coefficient of all the predictors.
Gender was coded as a binary variable, and therefore, is not suitable for a regression.

BONUS: What was your favorite topic this semester?
T-tests
ANOVAs
Correlation & Regression
Something else?

