
 Worksheets
science unit 2
Total questions: 27
Worksheet time: 27mins
Which of these things will most likely increase the salinity of a region of the ocean?
The evaporation of seawater
the thawing of a large iceberg
increased precipitation
runoff from a large river
Which pie chart shows the relative proportions of Earth's water in each location?


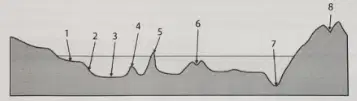
Use the diagram of the geographical features found in the ocean to answer the following question. What symbolizes the continental shelf?
3
1
4
7
Which of the following characteristics alters the density of ocean water?
temperature and wave speed
wave speed and wave size
wave size and salinity
salinity and temperature
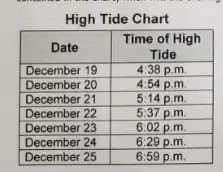
The evening high tides for one week in Sanibel Island, Florida, are listed below. Based on the data contained in the chart, when will the evening high tide most likely occur on December 26th?
7:32 p.m.
6:15 p.m.
11:25 p.m.
8:20 p.m.

The picture shows ocean landforms. Which number identifies a mid-ocean ridge?
2
1
3
5
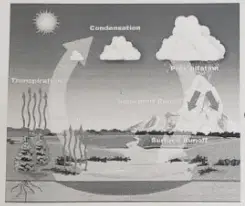
The model below shows the water cycle. What is the purpose of this model?
to illustrate how some water is lost on Earth as some of it never returns to Earth's surface once it evaporates
to show how severe weather forms in the water cycle
to illustrate how water travels from Earth's surface into the atmosphere and back to Earth's surface again
to illustrate how Earth's water formed a few thousand of years ago
Where does most of the water evaporation on Earth come from?
Rivers
oceans
ground water
surface lakes
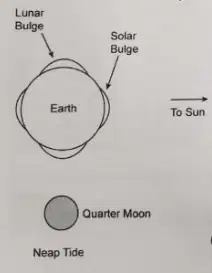
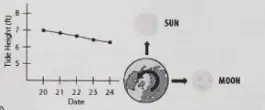
The diagram shows Earth, the Moon, and the Sun during neap tides. When the Moon is in its first quarter and third quarter phases, the gravitational forces of the Sun and Moon pull at 90 degree angles from one another. this means that when the Moon is in its first quarter and third quarter phases,
low tides are at their lowest levels.
high tides are at their lowest levels.
low tides are experienced worldwide at the same time.
high tides are experienced worldwide at the same time.
Where is most of the Earth's freshwater located
oceans
rivers and streams
aquifers
icecaps and glaciers
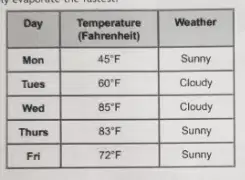
Tanya makes a table with the weather conditions in a body of water for five days. What day did the body of water most likely evaporate the fastest?
Monday
Tuesday
Thursday
Friday
Which part of the ocean would have the lowest salinity?
in an area near melting glaciers
in areas with little rainfall
an ocean trench
areas near the equator
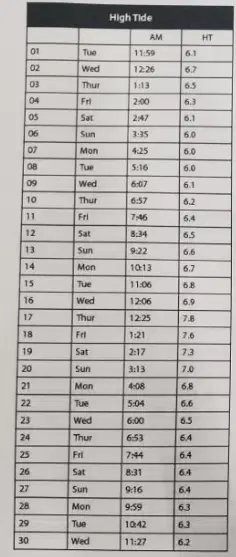
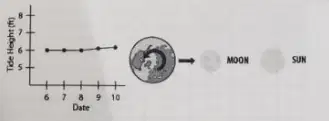
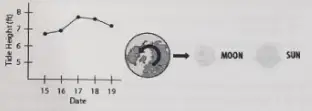
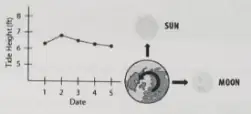
Spring tides don't only happen in the spring season. A spring tide occurs each time the Earth, sun, and moon line up with one another. This alignment causes the gravitational pull of the moon and sun to combine, creating tides that are higher than normal. Examine the tide table that shows the data for the month of June. Choose the response that demonstrates the correct alignment of the sun, the earth, and the moon that would create a spring tide, as well as the corresponding graph of the data from the table that shows a spring tide occurring.
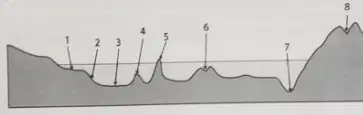
Use the diagram. What symbolizes the abyssal plain?
7
6
5
3
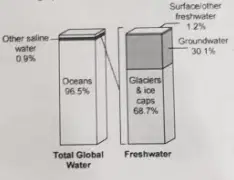
The graph shows the distribution of water on Earth's surface. What can be concluded from the image?
Most water on Earth is drinkable.
Most of the freshwater on Earth is found in groundwater.
Most of the water on Earth is not drinkable
Most of the Earth's fresh water is found in the oceans.
When the air temperature decreases, the rate of evaporation
increases
decreases
may increase or decrease
stays constant
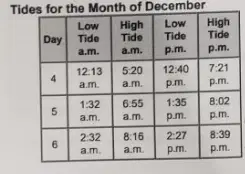
The level of the ocean rises and falls each day. These changes are called tides. A tide table shows when the tide will rise to a high tide and when it will fall to a low tide at a particular location. Study the patterns in the tide table shown below. Which of the following is a reasonable tide time on day 7?
low tide at about 3:05 a.m.
low tide at about 4:55 a.m.
high tide at about 8:20 a.m.
high tide at about 10:30 a.m.
What is the term for water that moves across the surface of the land and enters streams and rivers?
water table
groundwater
runoff
unconfined aquifer
Which of the following has the biggest effect on deep ocean currents?
temperature and salinity
tides and wind
tides and salinity
temperature and wind
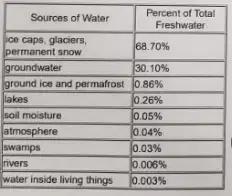
The table shows the global distribution of freshwater sources. there are over 40 million cubic kilometers of freshwater on Earth. Why is water conservation an important issue?
Freshwater is disappearing quickly due to the melting of ground ice and permafrost.
Less than 1% of Earth's freshwater is immediately available for use by humans.
The only freshwater that is usable by humans is contained inside living things.
Over 99% of Earth's available water is undrinkable due to its salt content.
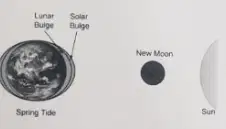
The diagram shows Earth, the Moon, and the Sun during spring tides. A graph is made showing the alignment of the Earth, Moon, and Sun during new moon and full moon phases in comparison to the high tides on Earth. Which statement describes what the graph would show?
It causes the high tide to occur at the same time everywhere on Earth.
It causes the tides to be higher than average.
It causes the tides to be at the same height everywhere on Earth.
It causes the tides to be lower than average.
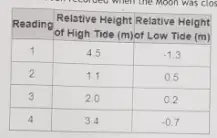
Over the course of a month, Ruby observed the tides at a local beach. She recorded the heights of the high and low tides relative to the average water level. Some of her readings are shown in the table. Which reading was most likely to have been recorded when the Moon was closest to Earth?
1
2
3
4
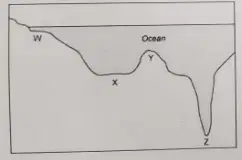
The diagram shows the topography of an ocean floor. Which area on the diagram most likely has water with the highest salinity?
W
X
Y
Z
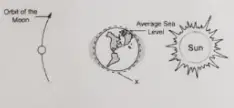
The diagram illustrates the effect of the Moon's and Sun's gravity on Earth. What is happening at point X in the diagram?
low tide
high tide
solar tide
average sea level
Evaporation in the water cycle is most affected by
Earth's rotation
Earth's Landforms
the Sun's energy
human activities
The main driving force of ocean surface currents is
The Coriolis effect
winds
Centripetal force
gyres
Jack takes a bottle of juice out of the refrigerator. He notices that water begins to form on the outside of the bottle. Which of the following explains why the water started to form?
Evaporation occurs on the bottle because the room is cooler than the bottle.
The bottle is freezing because the room is cooler than the bottle.
The bottle is melting because the room is warmer than the bottle.
Condensation forms on the bottle because the room is warmer than the bottle.

