
 Worksheets
Scatterplot Correlation Coefficients and Line of Best Fit
Total questions: 20
Worksheet time: 20mins
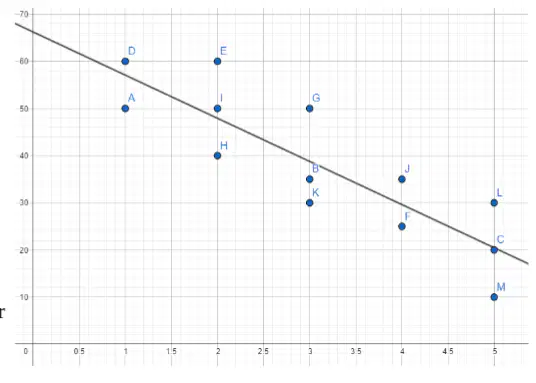
Thirteen young adults kept track of how many hours they worked at a restaurant and how many texts they sent during their shift. The equation of the line of best fit is: y = 9.15x + 66.23. The correlation coefficient for the data is r = -0.859. Which statements about the scenario are true?
The value of the correlation coefficient is very close to -1, so there is no association between the number of hours worked and the number of texts sent.
The line of best fit indicates, in general, the number of texts sent, on average, about 9 less for every hour that is worked.
If the linear trend holds, the number of texts sent would be 0 for someone who has worked 8,274 hours in a shift.
The number of texts sent during a shift tends to decrease as the number of hours increases.
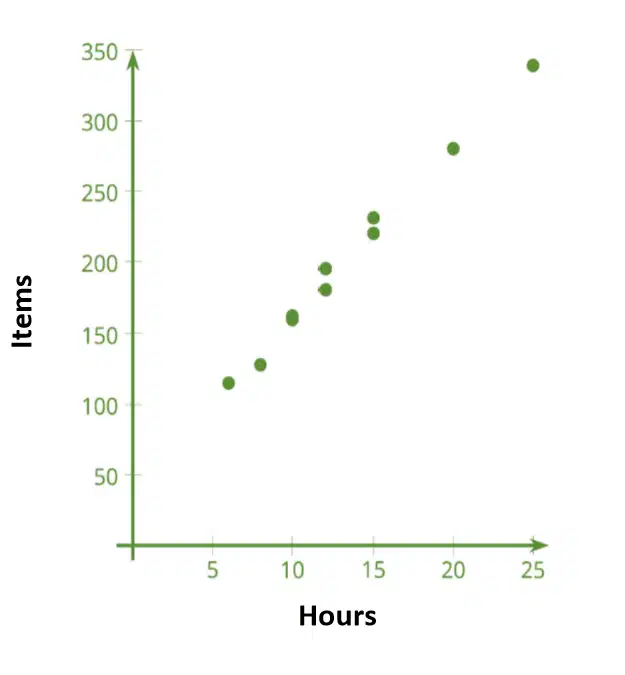
Sylvie likes to help her local food pantry and collect donations from local stores and restaurants. The scatter plot shows the comparison between the hours she works, x, and the number of goods that were donated that she collected, y. The line of best fit of the data is y = 15x + 31. Which statements about the plot, data, and correlation are true? Select all that apply.
There is a weak positive correlation bewteen the variables.
If Sylvie works for 8 hours, she can reasonably estimate she will collect around 150 items.
The correlation coefficient is likely between r = 0.33 and r = 0. 66.
There is a possible causal relationship betwen the number of hours Sylvie works and the numer of items she collects for the food pantry.
Which of the following statements indicates a weak negative correlation?
It is reasonable to assume a correlation coefficient is around -0.3 for the scenario.
The slope of the line of best fit for the scenario will be close to 1.
The correlation coefficient will be closer to -1 than it is to 0.
The slope of the line of best fit for the related scatterplot will be negative.
Actual data creates the point (6, 7.8) on a scatterplot. The equation of the line best fit for the data estimates that y is 8.6 when x is 6. What is the residual for the point (6, 7.8)?
-0.8
8
-6.7
1.8

Which graph has a correlation coefficient (r) of about -.6 ?
a
b
c
d

Positive
Negative
None

Which of the following could be a possible line of best fit for the data?
y = 3x + 0
y = 5/6x + 490
y = -2x + 470
non linear
Of the correlation coefficients below, which is most likely describing two variables that have no relationship?
r = -0.95
r = 0.01
r = 0.39
r = -0.68
Cinder creates a scatterplot that displays the relationship between the grams of food he eats, x, and the number “zoomie” laps he runs around the apartment, y. Cinder creates a line of best fit and finds: The residual for the point (2.3, 1280) is 128. The residual for the point (2.1, 1403) is -101. Based on this information, which statements about the data and line of best fit are true? Select all that apply.
The line of best fit overestimated the data for x = 2.3.
The line of best fit overestimated the data for x = 2.1.
The line of best fit underestimated the data for x = 2.3.
The line of best fit underestimated the data for x = 2.1.
Examine the scatterplots below.
Match each scatterplot to its most reasonable correlation coefficient.

r = 0.98

r = 0.60

r = 0.83
Order the following correlation coefficients from the weakest correlation to the strongest correlation.
0.76, -0.28, -0.94, 0.55
-0.28, 0.55, 0.76, -0.94
-0.94, 0.76, 0.55, -0.28
0.55, 0.76, -0.28, -0.94

Which scatter plot shows no relationship?
Graph A
Graph B
Graph C
Graph D

A restaurant sells pizza for the prices in the data table. Calculate the linear regression equation of the data.
y = 1.5x + 12
y = 12x + 1.5
y = 0.67x - 8
y = -8x + 0.67

Predict what the next point would be on the scatterplot.
(30,100)
(20,20)
(10,0)
What is a best-fit line used for?
To make predictions
To make the graph look pretty
To connect the points
To make it look like you know what you are doing

The annual profits for a company are given in the following table, where x represents the number of years since 1992, and y represents the profit in thousands of dollars. Write the linear regression equation that represents this set of data, rounding all coefficients to the nearest hundredth. Using this equation, estimate the year in which the profits would reach 378 thousand dollars.
2029
2014
2003
8753
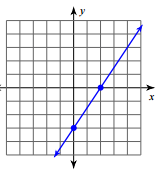
Find the slope.
3/2
-3/2
(-0,-3)
none of the above

Which equation represents the following graph?
y = 3x + 2
y = -2x + 3
y = 2x + 3
y = -3x + 2

Which of the following lines represents the line of best fit for the scatter plot?
A
B
C
D

The table represents the distance, y, a personal travels in their car after driving x hours. Which of the following best represents the line of best fit?
y=61.93x−1.79
y=−1.79x+61.93
y=0.016x+0.03
y=0.03x+0.016

