
 Worksheets
Summative Test (Unit)
Total questions: 50
Worksheet time: 50mins
It is a numerical quantity that is assigned to the outcome of an experiment.
Statistics
Random Variable
Probability
Distribution
Variables that are expressed as a whole and is countable.
Continuous
Discrete
Nominal
Ordinal
Which of the following is a discrete random variable?
The amount of paint used in repainting a building
The average amount of electricity consumed
The average weight of female athletes
The number of patients in a hospital
It is the set of all possible outcomes in an experiment.
Data
Mean
Random Variable
Sample Space
Probability can be between what two numbers?
10 and 20
0 and 100
0 and 10
0 and 1

Find the probability of rolling greater than a 3 on a single die.
5/6
4/6
3/6
2/6

Supposed two coins are tossed consecutively and we are interested in the number of heads that will come out. Determine the values of the random variable H (number of heads).
0, 1, 2
0, 1, 2, 3
1, 2
1, 2, 3

A coin is tossed three times. How many total outcomes are possible?
4
6
8
16
A couple has four children, let X be the number of boy. What are the possible random variable of X?
X = {boy, girl}
X = {0, 1, 2, 3}
X = {0, 1, 2, 3, 4}
X = {1, 2, 3, 4}
Which of the following random variable is continuous?
speed of bus
number of female students
number defective mobile phone
Choosing a natural number less than 100
Two coins are tossed, which is NOT a possible value of the random variable for the number of heads?
0
1
2
3
What is the set of possible values for "the number of games in a best of five basketball championship games."
{0, 1, 2, 3, 4, 5}
{3, 4, 5}
{3, 4}
{5}
What is the term used for the set of all possible outcomes in an experiment?
Discrete
Continuous
Sample space
Random variables
Which of the following can serve as the values of a probability distribution?
P(1) = 0.42
P(2) = 0.31
P(3)= 0.37
P(1) = 9/14
P(2) = 4/14
P(3)= 1/14
P(1) = 0.08
P(2) = 0.12
P(3)= 1.03
P(1) = 10/33
P(2) = 12/33
P(3)= 10/33
If P(X) = X /6 , what are the possible values of X for it to be a probability distribution?
0, 2, 3
1, 2, 3
2, 3, 4
1, 1, 2

The table shows the probability distribution of a discrete random variable "x". What is the probability of x greater than 80 or P(x>80).
0.10
0.15
0.20
0.40
Which of the following is the formula in finding the mean of the probability distribution?
ΣX⋅P(X)
ΣX2⋅P(X)
ΣX⋅P(X)
Σ[X⋅P(X)]

Find the mean of a discrete random variable x whose probability distribution is shown in the table.
1.1
1.2
1.3
1.4
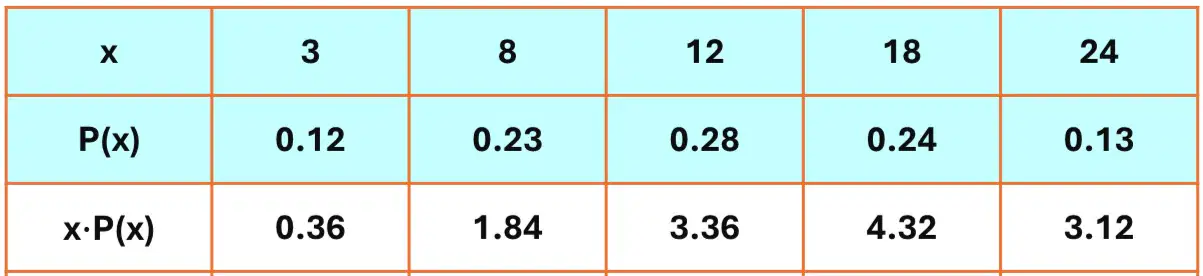
Mark opened a barber shop. He has compiled the following probability distribution of the number of customers he is likely to get each day. How many customers does he expect per day?
10
11
12
13
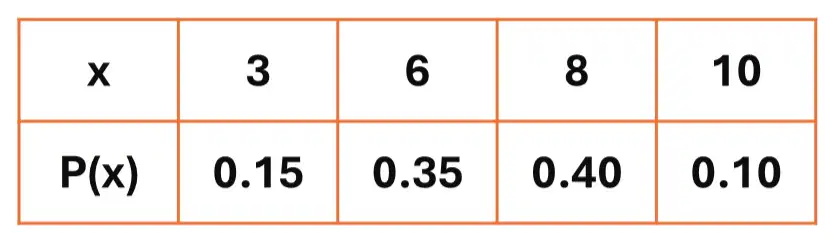
Find the mean of a discrete random variable x whose probability distribution is shown in the table.
5.75
6.75
7.75
8.75
It is the expected outcome of an experiment or event.
mean
median
standard deviation
variance
It is the measure of the spread of data or its distance from the mean.
mean
median
standard deviation
variance
Which of the following is the formula in finding the standard deviation of the probability distribution?
Σ[X2⋅P(X)]−μ2
ΣX2⋅P(X)−μ2
Σ[X2⋅P(X)]−μ2
ΣX2⋅P(X)−μ2

Find the mean of the given discrete random variable.
3.56
3.66
3.76
3.86
Find the variance σ2 of a discrete random variable x whose probability distribution is shown in the table.
2.06
2.07
2.64
2.74
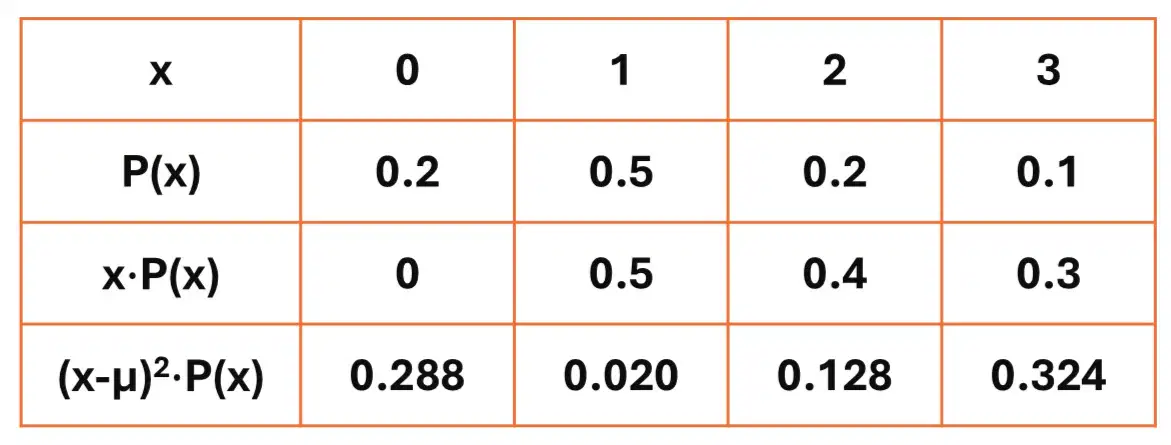
Find the standard deviation σ of the discrete random variable x whose probability distribution is shown in the table.
0.76
0.77
0.86
0.87

Based on the table, find the standard deviation of the distribution of the discrete random variables summarized in the table. Round off your answer in the nearest hundredths.
1.44
1.46
2.06
3.66
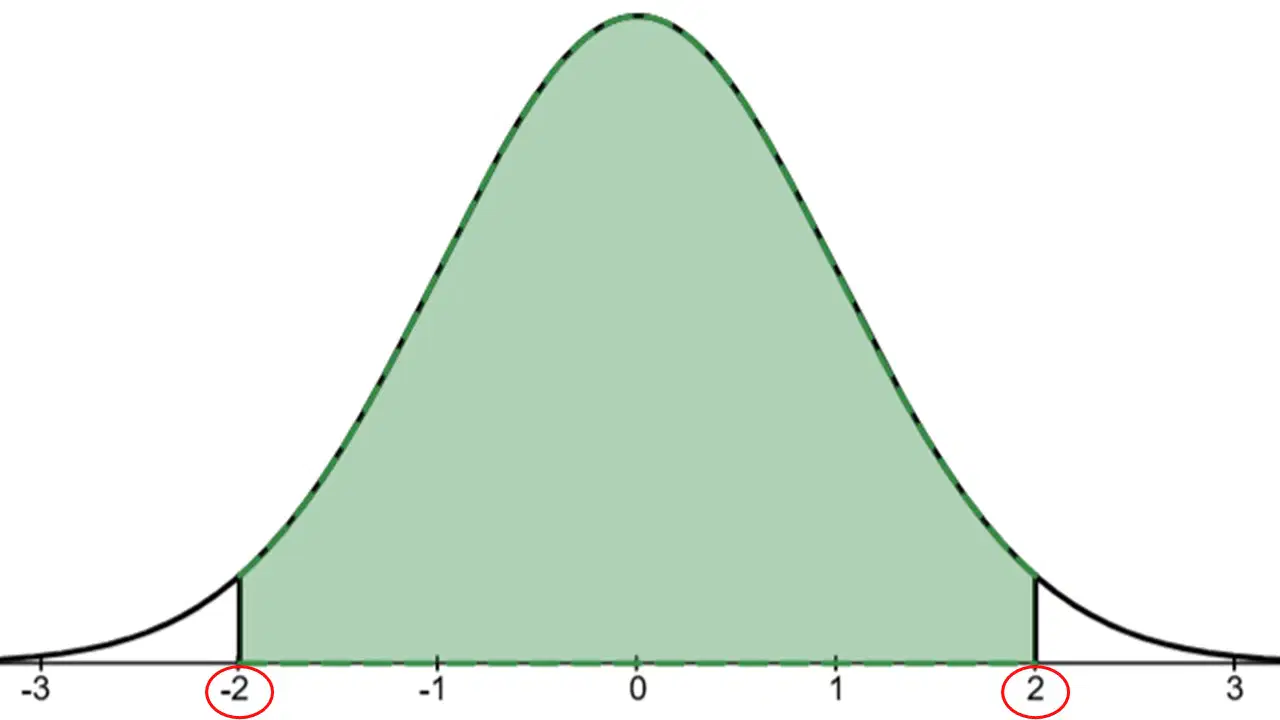
The data is normally distributed. What percent of the data is in the shaded region?
68%
81.5%
95%
99.7%

The data is normally distributed. What percent of the data is in the shaded region?
68%
81.5%
83.85%
95%
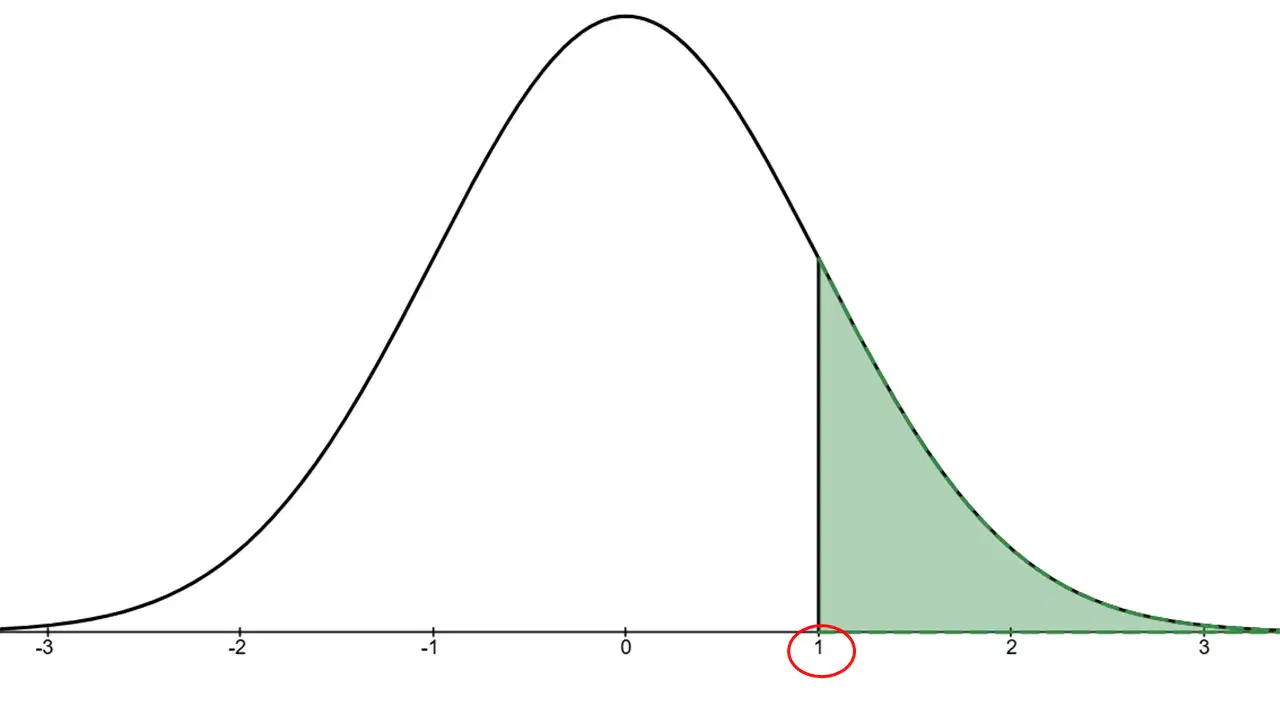
The data is normally distributed. What percent of the data is in the shaded region?
5%
12%
16%
32%
The shelf life of a particular dairy product is normally distributed with a mean of 12 days and a standard deviation of 3 days. About what percent of the products last 6 days or less?
2.5%
5%
16%
32%
Scores on a certain standardized test have a mean of 500, and a standard deviation of 100. How common is a score between 600 and 700? Calculate the probability.
2.35%
2.5%
13.5%
16%
A set of test scores are normally distributed with a mean of 70 and a standard deviation of 6. Between what two scores will 68% of the scores lie?
64-70
70-76
58-82
64-76
On a standardized test Cathy scored a 74, which was exactly 1 standard deviation below the mean. If the standard deviation for the test is 5, what is the mean score for the test?
61
68
79
95
What is the total area under the normal curve in a standard normal distribution?
0
1
2
3
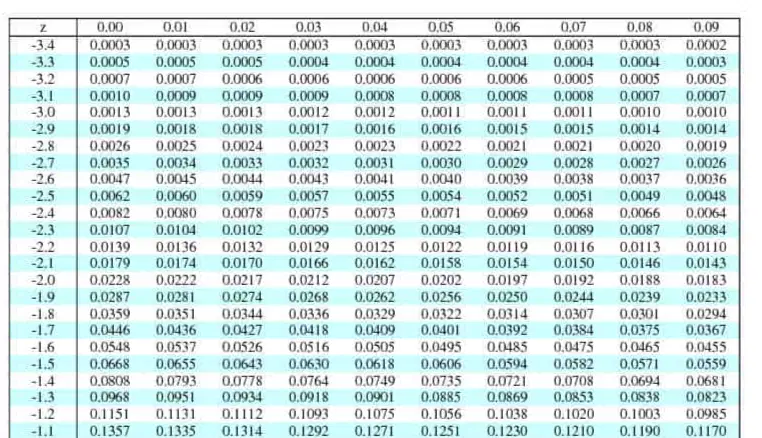
Find the area under the standard normal curve to the right of z = -2.67.
0.0008
0.0869
0.1234
0.9962

Find the area under the normal distribution curve between
z=-1.53 and z=0.
0.063
0.500
0.437
0.563
Given x=40 ; μ=16 ; σ= 8. Find the z-score.
-2.5
-3.0
2.5
3.0
Suppose you have a set of test scores that are normally distributed with mean equal to 82 and standard deviation equal to 6. If Ana got 91, what is her z-score?
0.5
1.0
1.5
2.0
Math exam scores are normally distributed with a mean of 82 and a standard deviation of 4. If Meriam got a z-score of 1.25, what is her exam score?
85
86
87
88

Assuming that the scores of Grade 11 Students in Statistics and Probability in their third quarter test are normally distributed with a mean of 50 and Standard deviation of 5. If the z-score of Juan's raw score is 2, find his raw score and percentage of students who scored below his score.
X=60
P = 97.72%
X=60
P= 95%
X= 40
P = 65.62%
X=40
P= 47.72%
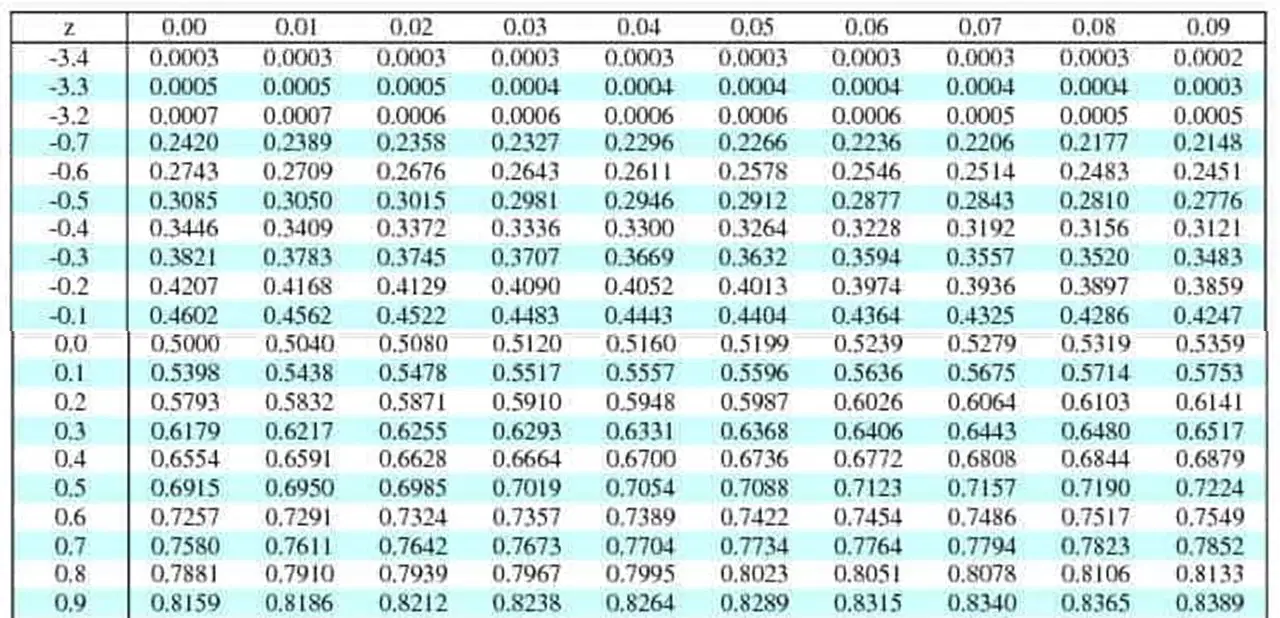
The length of time it takes a Grade 11 student to use TikTok follows a normal distribution with a mean of 35 minutes and a standard deviation of 10 minutes. Find the probability that a randomly selected Grade 11 student will use TikTok in at least 41 minutes. Express your final answer in percent.
27.43%
30.85%
69.15%
72.57%

These symbols represent the mean and standard deviation for which of the following distributions?
the population
the sample
the sampling distribution
normal distribution
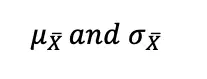
These symbols represent the mean and standard deviation for which of the following distributions?
the population
the sample
the sampling distribution
normal distribution
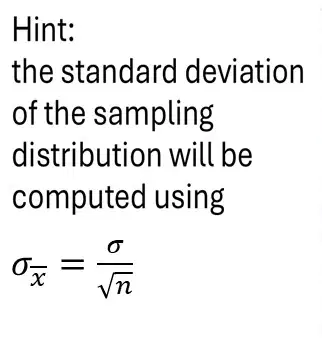
The mean and standard deviation of a population are 200 and 20, respectively. Sample size is 25.
What is the standard deviation of the sampling distribution?
200
25
16
4
The mean and standard deviation of a population are 200 and 20, respectively. Sample size is 25.
What is the mean of the sampling distribution?
200
25
16
4
At a particular college, 78% of all students are receiving some kind of financial aid. The school newspaper selects a random sample of 100 students and 72% of the respondents say they are receiving some sort of financial aid. Which of the following is true?
78% is a population and 72% is a sample.
72% is a population and 78% is a sample
78% is a parameter and 72% is a statistic
72% is a parameter and 78% is a statistic
What name refers to the standard deviation of the sampling distribution?
mean deviation
sampling deviation
sampling error
standard error
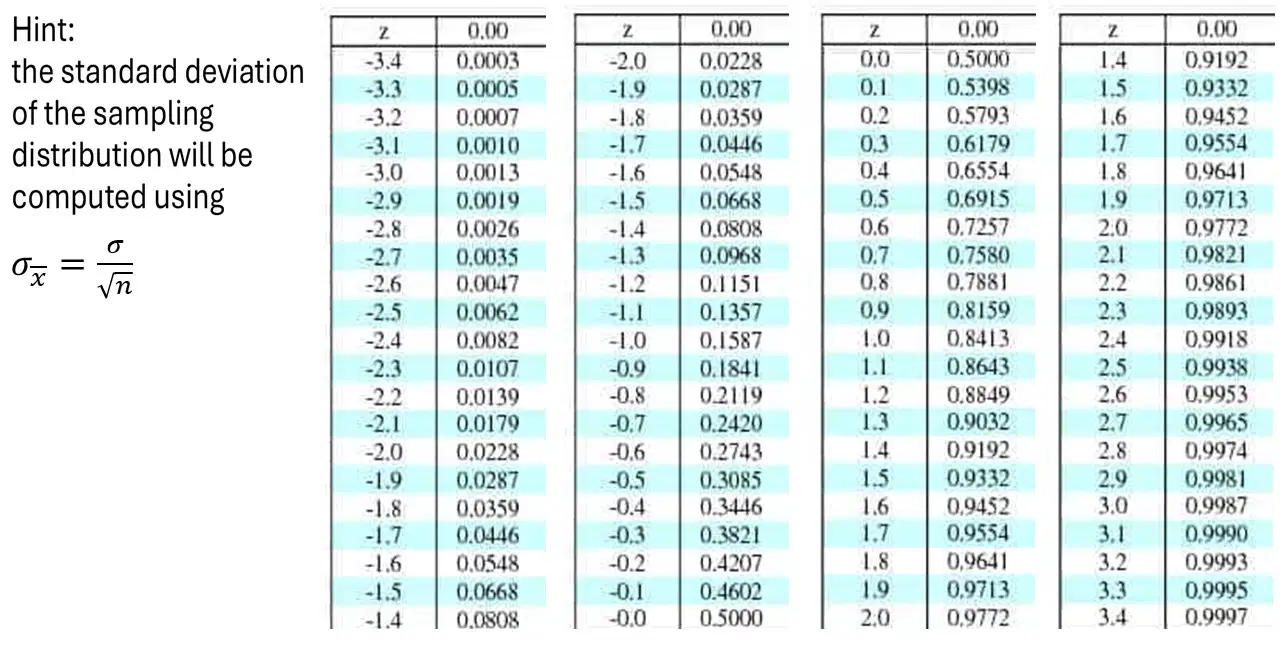
The mean and standard deviation of a population are 200 and 20, respectively. What is the probability of selecting 25 data values with a mean less than 190?
0.6%
31%
69%
99%

The mean and standard deviation of a population are 200 and 20, respectively. Sample size is 25. What is the standard error of the sampling distribution?
200
25
16
4

