
NEW
Font size
 Worksheets
Review Test Research III
Total questions: 44
Worksheet time: 22mins
When all the values in a distribution are the same, the variance is ___________.
one
zero
maximum
cannot be determined
Which of the following is CORRECT about the variance?
The smaller the variance, the more heterogenous are the data values.
The bigger the variance, the data tends to deviate less from the mean.
The lesser the variance, the data values tend to deviate more from the mean.
The bigger the variance, the data values tend to deviate more from the mean.
Which among the following is NOT true about the measures of variation?
It is also known as measures of spread.
The lower the variability the lesser the spread of scores.
The higher the variability the higher the spread of scores.
It does not tell us that the scores are compressed or spread out.
The average score in the test of section A is 36. Section B also gained the same average scores on the same test. However, section A has a standard deviation of 3.8 while section B has a standard deviation of 1.9. In which section are the scores less dispersed?
section A
section B
no enough information
could not be determined
A financial analyst sampled the top six companies' book value (in billions of pesos). They are:
7, 15, 18, 22, 25, 33
Approximately, what is the sample mean, as well as the sample standard deviation?
20 and 7.2 respectively
20 and 8.9 respectively
120 and 9.2 respectively
120 and 8.9 respectively
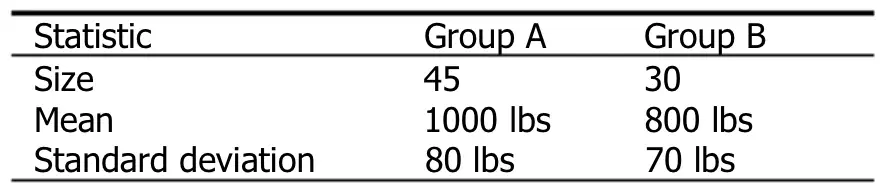
Which of the following statements is correct?
Group A is more varied than Group B because the sample size is larger.
Group A is less varied than Group B because Group A's standard deviation is bigger.
Group A is less varied than Group B because its standard deviation per animal is smaller.
Group A is relatively less varied than Group B because Group A's coefficient of variation is smaller.
Which of the following is a statistical method that measures the strength of the linear relationship between two variables?
z-value
scatterplot
testing hypothesis
Pearson correlation
In the Pearson r, what does n represent?
sum of x-values
sum of square x-values
number of paired values
sum of the products of paired values x and y
Which of the following values CANNOT represent a correlation coefficient r ?
-1
0
0.35
1.05
Which of the following is the range of the correlation coefficient (r)?
-1 < r < 1
-1 ≤ r ≤ 1
0 ≤ r ≤ 1
1 ≤ r ≤ -1
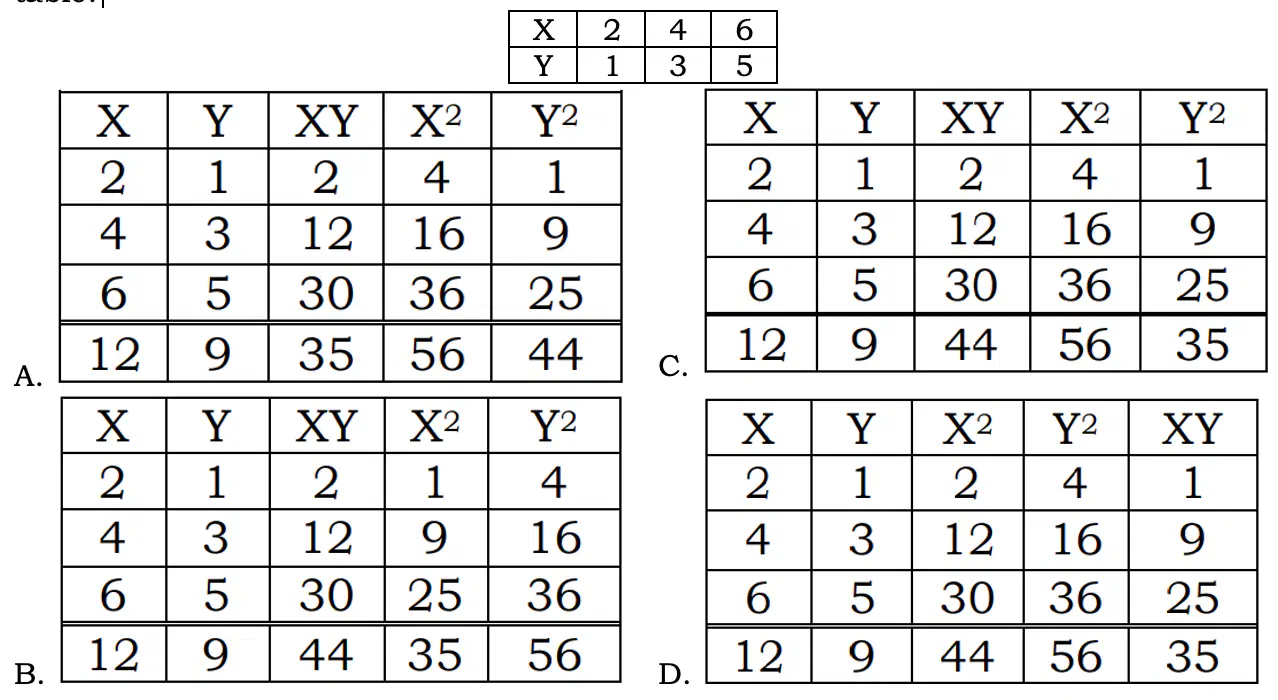
Which among the choices is the correct completed table?
A
B
C
D
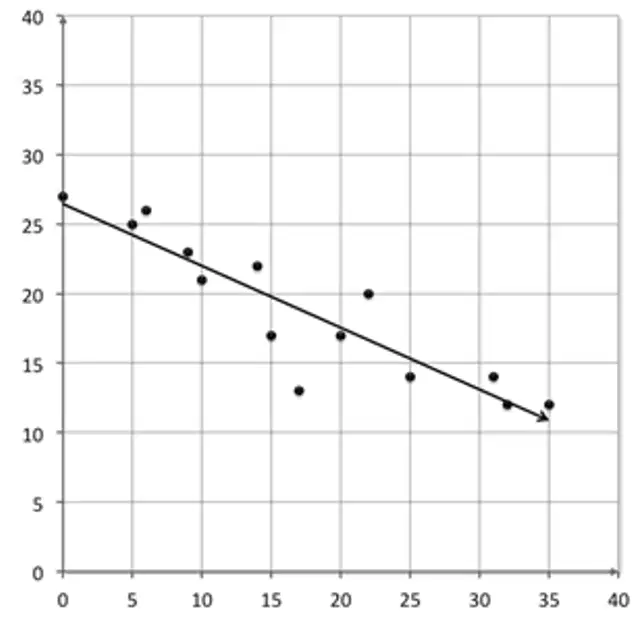
What conclusion can the researcher draw based on the scatter plot?
The variables do not correlate.
The variables have a strong correlation.
The variables have a perfect correlation.
The variables have a moderate correlation.
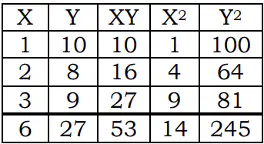
Given the bivariate data table below what will be the value of r?
-0.5
-0.25
0.75
0.95
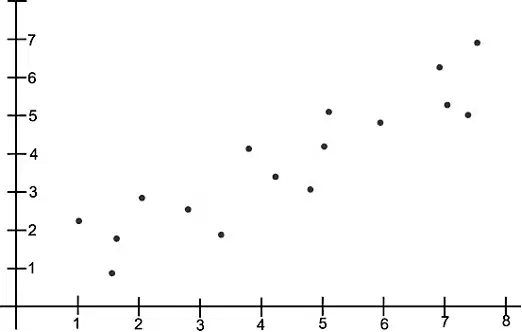
What is assumed to be its ρ?
-1
0
1
2
If you have two values tied for the 10th and the 11th place, then what rank do you put for both of them?
10
10.5
11
11.5
The spearman's rank correlation coefficient for the Grade 9 STATISTICS and CONSUMER CHEMISTRY scores is 0.91. Which of the following is true?
There is a weak positive correlation.
There is a weak negative correlation.
There is a strong positive correlation.
There is a strong negative correlation.
Spearman's correlation coefficient computation is unique in what way?
It can be used with more than two variables at a time.
It uses the differences in the data as part of the calculation.
It uses the ranked value of the input data as part of the calculation.
It is better at handling random data than other correlation techniques.
What assumption about the data is measured by Spearman's correlation coefficient in comparison to Pearson's correlation calculation?
That the data is random
That the data has a linear trend
That the data has a monotonic trend
That the data has an exponential trend
When will the prediction of an individual's score on the criterion variable based on our knowledge of this individual's value on the predictor variable be more accurate?
When there is no correlation between the two variables.
When the correlation between the two variables is weak.
When the correlation between the two variables is strong.
When the correlation between the two variables is moderate.
What is the possible interpretation of the
ρ = -0.38?
Low Positive Correlation, as the variable increases, the other variable partially increases.
Low Positive Correlation, as the variable increases, the other variable partially decreases.
Low Negative Correlation, as the variable increases, the other variable partially increases.
Low Negative Correlation, as the variable increases, the other variable partially decreases.

What is the Spearman rank correlation coefficient?
0.1636
0.794
0.8364
0.8606
What is the set of statistical methods used to describe the relationship between independent variables and a dependent variable?
regression analysis
regression equation
regression form
regression line
A researcher is investigating the relationship between the number of hours students study per week and their scores on a standardized test. What is the independent variable (x) in this study?
The students
The standardized test score
The number of hours studied per week
The relationship between study time and test scores
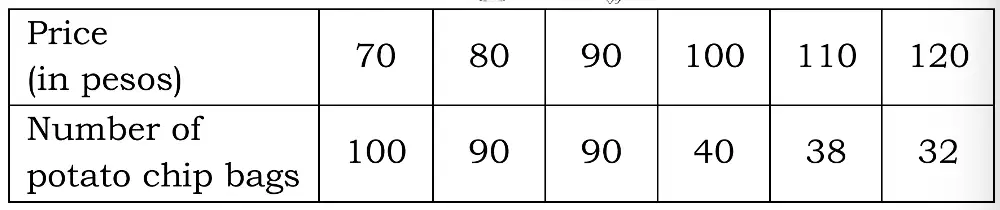
What is the estimated slope of the regression equation?
– 213.2
– 1.56
1.56
213.2
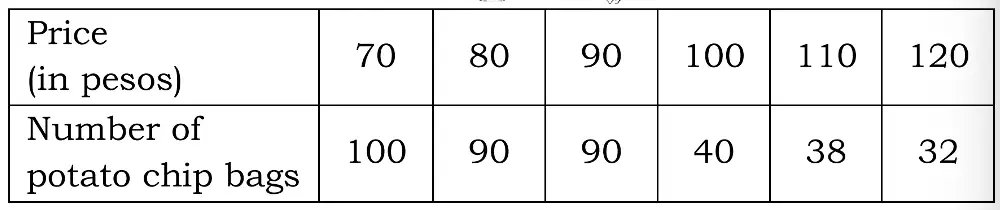
What is the y-intercept of the regression equation?
– 213.2
1.56
– 1.56
213.2

What is the regression equation based on the data given?
ŷ = – 213.2 – 1.56x
ŷ = – 213.2 + 1.56x
ŷ = 213.2 – 1.56x
ŷ = 213.2 + 1.56x
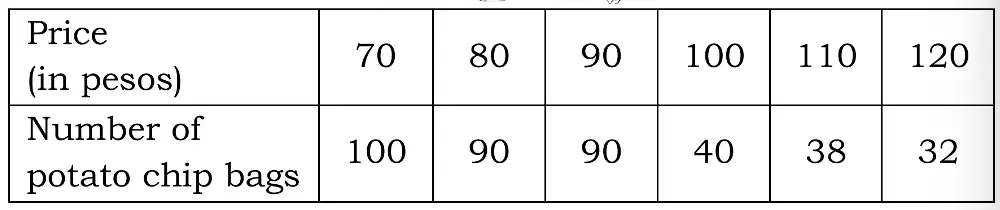
What is the average number of potato chips sold if the price of a bag of potato chips is ₱ 75.00?
56
65
76
96
The linear regression equation is y = 61.93x - 1.79. Use the equation to predict how far this person will travel after 5 hours of driving.
307.86 miles
0.19 miles
10 miles
500 miles
If the regression equation is ŷ = -4 + 5x, how would you predict the value of
the dependent variable if the value of the independent variable is 5?
Solve for x using the slope formula.
Solve for y using the slope formula.
Substitute ŷ = 5 into ŷ = -4 + 5x and solve.
Substitute x = 5 into ŷ = -4 + 5x and solve.
Colgate is one of the manufacturers of toothpaste which uses a machine to dispense liquid ingredients into bottles that move along a filling line. The owner claims that the machine can dispense at an average of 50 grams with a standard deviation of 0.7 grams. A sample of 35 bottles was selected and it was found that the average amount dispensed in the sample was 49.3 grams. Test the claims of the owner of the company at a 5% level of significance.
What test statistic will be used from the situation given?
t-test
z-test
population mean
standard deviation
Colgate is one of the manufacturers of toothpaste which uses a machine to dispense liquid ingredients into bottles that move along a filling line. The owner claims that the machine can dispense at an average of 50 grams with a standard deviation of 0.7 grams. A sample of 35 bottles was selected and it was found that the average amount dispensed in the sample was 49.3 grams. Test the claims of the owner of the company at a 5% level of significance.
Which of the following information is CORRECT?
𝛼 = 0.5
𝜎 = 0.7
𝑥̅ = 35
𝜇 = 49.3
Based on the situation given, what is the computed value?
-5.916
-4.950
4.950
5.916
A coffee shop needs to produce bottles that will hold 12 ounces of liquid. Periodically, the company gets complaints that their bottles are not holding enough liquid. To test this claim, the bottling company randomly sampled 36 bottles. Suppose the p-value of this test turned out to be 0.0455. State the proper conclusion.
At α = 0.05, reject the null hypothesis.
At α = 0.025, reject the null hypothesis.
At α = 0.035, accept the null hypothesis.
At α = 0.085, fail to reject the null hypothesis.
An investigator randomly assigns 30 college students into three equal size study groups (early- morning, afternoon, late-night) to determine if the period of the day at which people study affects their retention. The students live in a controlled environment for one week, on the third day of the experimental treatment is administered (study of predetermined material). On the seventh day the investigator tests for retention. In computing his ANOVA table, he sees that his MS within groups is larger than his MS between groups. What does this result indicate?
An error in the calculations was made.
There should have been additional controls in the experiment.
There was more than the expected amount of variability between groups.
There was more variability between subjects within the same group than there was between groups.
A botanist is studying the growth of a particular species of plant. A previous study indicated that the average height of the plant at maturity was 15 inches. The botanist suspects that a new fertilizer might increase the average height. They take a random sample of 25 plants grown with the new fertilizer and measure their heights. Let μ represent the average height of this plant species grown with the new fertilizer.
Which of the following is the appropriate set of hypotheses for the botanist's significance test?
H₀: μ = 15 inches Hₐ: μ < 15 inches
H₀: μ = 15 inches Hₐ: μ > 15 inches
H₀: μ = 15 inches Hₐ: μ ≠ 15 inches
H₀: μ > 15 inches Hₐ: μ = 15 inches
A light bulb manufacturer claims that its light bulbs have a mean life of 40,000 km. A random sample of 46 of these light bulbs is tested and the sample mean is 38,000 km. Assume that the population’s standard deviation is 2,000 km and the lives of the light bulbs are approximately normally distributed. Determine the computed value at 5% level of significance.
-6.782
-3.033
3.033
6.782
A researcher is studying the effects of three different types of background music (classical, pop, and no music) on test performance. Participants are randomly assigned to one of the three groups, and their test scores are recorded. Which statistical test is most appropriate for comparing the average test scores of the three groups?
t-test
chi-square test
ANOVA (analysis of variance)
correlation coefficient
The null hypothesis for an ANOVA states that __________.
All of the population means are different from each other.
There are no differences between any of the population means.
At least one of the population means is different from the others.
There are some differences between any of the population means.
What two pieces of information are needed to determine the critical value?
MSb, MSw
Sample size, number of groups
Mean, sample standard deviation.
Expected frequency, obtained frequency.
A researcher is investigating the effectiveness of four different learning methods (online modules, in-person lectures, group projects, and self-study) on student test scores. Students are randomly assigned to one of the four methods. What type of ANOVA test is most appropriate to analyze the data?
One-Way ANOVA
Two-Way ANOVA
Three-Way ANOVA
Four-Way ANOVA
A researcher is studying the effects of four different fertilizers on plant growth. Four groups of plants are grown, each receiving a different fertilizer. After a set period, the height of each plant is measured.
If the researcher conducts an ANOVA test on the plant height data, what will a significant F-statistic indicate?
The fertilizers have no effect on plant growth.
All four fertilizers have significantly different effects on plant growth.
There is no significant difference in plant growth between the four groups.
At least one fertilizer has a significantly different effect on plant growth compared to the others.
A medical researcher is testing a new diagnostic test for a rare disease.
Null Hypothesis (H0): The person does not have the disease.
Alternative Hypothesis (H1): The person has the disease.
The researcher tests a patient.
When is a Type I error committed?
The test is positive, and the patient has the disease.
The test is negative, and the patient does not have the disease.
The test is negative, but the patient has the disease.
The test is positive, but the patient does not have the disease.
What is the statistical method used in making decisions using experimental data?
Simple analysis
Analytical testing
Hypothesis testing
Experimental testing
If the coefficient determination is 0.95, what does it mean?
95% of the y values are positive.
95% of the y values are negative.
95% of the y values are predicted correctly by the model.
95% of the variation in y can be explained by the variation in x.

