
 Worksheets
Tally Chart
Total questions: 10
Worksheet time: 8mins
Name
Class
Date
1.

What type of graph is this?
a)
bar graph
b)
pictograph
c)
tally chart
2.
Which pet got the most votes?
a)
cats
b)
dogs
c)
fish
3.

How many tally marks?
a)
9
b)
6
c)
3
d)
7
4.

How many tally marks?
a)
10
b)
6
c)
5
d)
4
5.

What number is represented by this tally?
a)
5
b)
6
c)
7
d)
8
6.

Which fruit did most children choose?
a)
apple
b)
banana
c)
grapes
7.
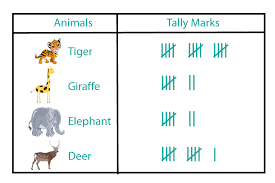
How many people voted for the Giraffe
a)
8
b)
7
c)
3
d)
2
8.
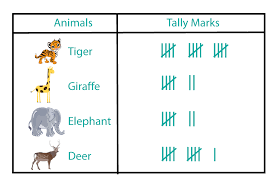
How many people voted for the Deer?
a)
11
b)
12
c)
15
d)
20
9.

What number does this tally mark represent?
a)
9
b)
12
c)
15
d)
1
10.
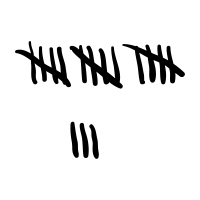
What number does this tally mark represent?
a)
20
b)
18
c)
25
d)
10
100 %

