
 Worksheets
Unit 7: Investigating Data - Wrap Up & Rewind
Total questions: 16
Worksheet time: 8mins
Imagine two different classes, Class A and Class B, that recently took the same mathematics test. The scores for each class were recorded and are shown below. Your task is to compare the two distributions using measures of center and standard deviation. Class A Scores: 62, 90, 42, 92, 88, 84, 91, 87, 97, 100 Class B Scores: 75, 80, 78, 85, 90, 82, 88, 84, 81, 87 A) What is the mean score for Class A?
81.3
83.3
85.5
87.6
Imagine two different classes, Class A and Class B, that recently took the same mathematics test. The scores for each class were recorded and are shown below. Your task is to compare the two distributions using measures of center and standard deviation. Class A Scores: 62, 90, 42, 92, 88, 84, 91, 87, 97, 100 Class B Scores: 75, 80, 78, 85, 90, 82, 88, 84, 81, 87 B) Calculate the standard deviation for both classes.
Class A: 17.8, Class B: 4.7
Class A: 15.3, Class B: 5.2
Class A: 17.8, Class B: 6.1
Class A: 20.1, Class B: 5.5

Kris says: "If I use hours of sleep as my independent variable and sleep quality as my dependent variable, I believe there will be a positive correlation." Jeremy says: "If I use the number of absences as my independent variable and test scores as my dependent variable, I believe there will be a positive correlation as well!" A) Which student is incorrect? Why?
A) Kris is incorrect because more hours of sleep generally lead to better sleep quality, indicating a positive correlation.
B) Jeremy is incorrect because more absences generally lead to lower test scores, indicating a negative correlation.
C) Both are correct as both scenarios can have positive correlations.
D) Both are incorrect as neither scenario can have positive correlations.
Your teacher asked you to create a situation where there is a positive correlation and a situation where there is a negative correlation. Explain.
A positive correlation is when two variables increase together, and a negative correlation is when one variable increases while the other decreases.
A positive correlation is when one variable increases and the other decreases, and a negative correlation is when two variables increase together.
A positive correlation is when two variables decrease together, and a negative correlation is when one variable decreases while the other increases.
A positive correlation is when one variable decreases and the other increases, and a negative correlation is when two variables decrease together.

Determine the strength of the correlation based on the graph provided.
Strong negative correlation
Weak negative correlation
Strong positive correlation
Weak positive correlation
No correlation

A class of students recorded the number of hours they studied in a week. The data collected and boxplot of the data are as follows: 4, 6, 7, 8, 8, 9, 10, 10, 11, 12, 14, 18, 22, 25. Determine if there are any outliers. Explain how you know.
There are no outliers in the data.
The outlier is 25.
The outliers are 22 and 25.
The outliers are 4 and 22.

Determine the median value and interquartile range (IQR) of the data.
The median value is 10.
The IQR is 6.
The median value is 15.
The IQR is 10.
The median value is 20. The IQR is 4.
The median value is 25.
The IQR is 6.

What assumptions can be made about the number of hours these students study in a week based on the information you’ve calculated?
The students study exactly 10 hours a week.
The students study more than 20 hours a week.
The students study less than 5 hours a week.
The students study between 8 to 14 hours a week.

Which set of data could be BEST modeled by a quadratic function?
a
b
c
d
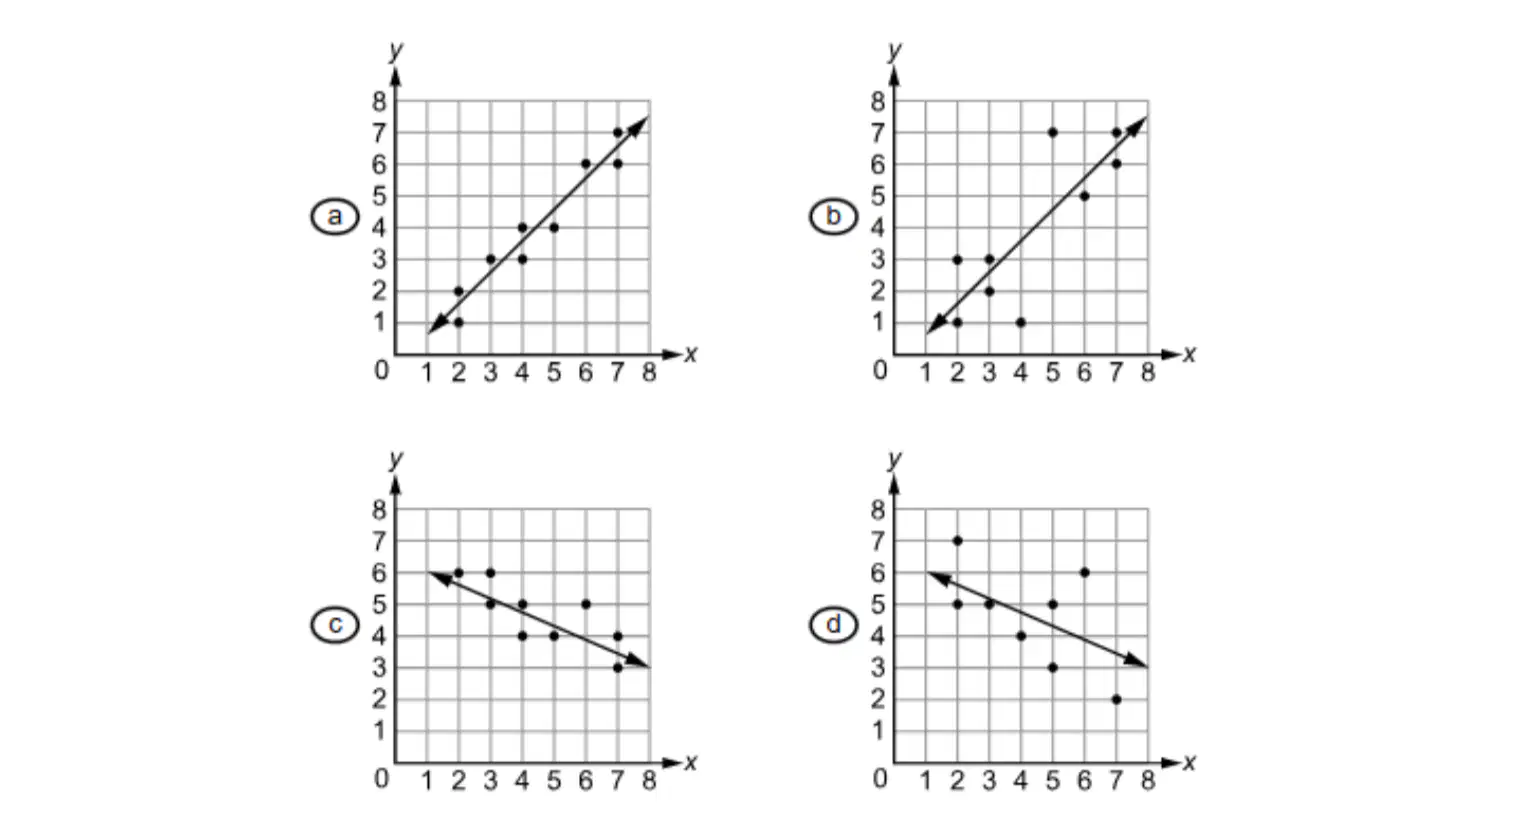
Which scatterplot shows the strongest positive correlation coefficient?
a
b
c
d

What is the appropriate measure of center for the data set?
Mean, because there is not an outlier
Median, because there is not an outlier
Mean, because there is an outlier
Median, because there is an outlier
Interpret the correlation coefficient:
r = 0.003
strong positive
strong negative
weak negative
no correlation

Which measure of center will be the smallest?
(Remember which one pulls toward the tail)
Median
Mean
Mode
Outlier
Interpret the correlation coefficient:
r = -0.875
strong positive
strong negative
weak negative
no correlation

A student who waits tables at a restaurant recorded the cost of meals and the tip left by single diners.
A) Use your calculator to determine the line of best fit.
B) If the next diner orders a meal costing $10.50, how much tip should the waiter expect to receive?
A) y=0.247206x-0.383536
B) $2.21
A) y=0.9973x-0.9947
B) $2.10
A) -0.206x+0.536
B) $3.75
A) y=-0.247206x+0.383536
B) $2.25

In the calibration of a thermometer, the height, H cm, is recorded at different temperatures. The results are listed in the table.
A) Calculate the line of best fit.
B) Estimate the height of the mercury when the temperature is 60° Celsius.
A) y=0.63063x+0.98604
B) 59.8 cm
A) y=0.98604x-0.63063
B) 59.8 cm
A) y=0.98604x+0.63063
B) 59.8 cm
A) y=-0.98604x-0.63063
B) 59.8 cm

