
 Worksheets
inference for 2
Total questions: 168
Worksheet time: 9hrs 1mins
A two-sample t-test for a difference in means was conducted to investigate whether defensive players on a football team can bench-press more weight, on average, than offensive players. The conditions for inference were met, and the test produced a test statistic of t=1.083 and a p-value of 0.15.
Based on the p-value and a significance level of �=0.05, which of the following is the correct conclusion?
Reject the null hypothesis because 0.15>0.05. There is not convincing evidence that defensive players can bench-press more weight, on average, than offensive players.
Reject the null hypothesis because 0.15>0.05. There is convincing evidence that defensive players can bench-press more weight, on average, than offensive players.
Fail to reject the null hypothesis because 0.15>0.05. There is not convincing evidence that defensive players can bench-press more weight, on average, than offensive players.
Fail to reject the null hypothesis because 0.15>0.05. There is convincing evidence that defensive players can bench-press more weight, on average, than offensive players.
Fail to reject the null hypothesis because 0.15>0.05. There is convincing evidence that defensive players can bench-press the same amount of weight, on average, as offensive players.
To test the durability of cell phone screens, phones are dropped from a height of 1 meter until they break. A random sample of 40 phones was selected from each of two manufacturers. The phones in the samples were dropped until the screens broke. The difference in the mean number of drops was recorded and used to construct the 90 percent confidence interval (0.46,1.82) to estimate the population difference in means.
Consider the sampling procedure taking place repeatedly. Each time samples are selected, the phones are dropped and the statistics are used to construct a 90 percent confidence interval for the difference in means. Which of the following statements is a correct interpretation of the intervals?
Approximately 90 percent of the intervals will extend from 0.46 to 1.82.
Approximately 90 percent of the intervals constructed will capture the difference in sample means.
Approximately 90 percent of the intervals constructed will capture the difference in population means.
Approximately 90 percent of the intervals constructed will capture at least one of the sample means.
Approximately 90 percent of the intervals constructed will capture at least one of the population means.
A national consumer agency selected independent random samples of 45 owners of newer cars (less than five years old) and 40 owners of older cars (more than five years old) to estimate the difference in mean dollar cost of yearly routine maintenance, such as oil changes, tire rotations, filters, and wiper blades. The agency found the mean dollar cost per year for newer cars was $195 with a standard deviation of $46. For older cars, the mean was $286 with a standard deviation of $58.
Which of the following represents the 95 percent confidence interval to estimate the difference (newer minus older) in the mean dollar cost of routine maintenance between newer and older cars?


Animal researchers studying cows and horses conducted a two-sample t-test for a difference in means to investigate whether grazing cows eat more grass, on average, than grazing horses. All conditions for inference were met, and the test produced a test statistic of t=1.664 and a p-value of 0.0487.
Which of the following is a correct interpretation of the p-value?
The probability that cows eat more grass than horses, on average, is 0.0487.
The probability that cows eat the same amount of grass as horses, on average, is 0.0487.
Assuming that the mean amount of grass eaten by cows is greater than the mean amount of grass eaten by horses, the probability of observing a test statistic of at most 1.664 is 0.0487.
Assuming that the mean amount of grass eaten by cows is equal to the mean amount of grass eaten by horses, the probability of observing a test statistic of at most 1.664 is 0.0487.
Assuming that the mean amount of grass eaten by cows is equal to the mean amount of grass eaten by horses, the probability of observing a test statistic of at least 1.664 is 0.0487.
A study was conducted to investigate whether the mean price of a dozen eggs was different for two different grocery stores, Store A and Store B, in a large city. A carton of one dozen eggs from each store was randomly selected for each of 35 weeks, for a total sample size of 35 cartons from each store. The mean price of the 35 cartons was recorded for each store. The difference in the mean carton price for the stores will be calculated.
Which of the following is the appropriate test for the study?
A one-sample t-test for a population proportion
A one-sample t-test for a sample mean
A matched-pairs t-test for a mean difference
A two-sample t-test for a difference between population means
A two-sample t-test for a difference between population proportions
A two-sample t-test for a difference in means was conducted to investigate whether the average time to swim a lap with the freestyle stroke is different from the average time to swim a lap with the butterfly stroke. With all conditions for inference met, the test produced a test statistic of t=−2.073 and a p-value of 0.042.
Based on the p-value and a significance level of alpha=0.05, which of the following is a correct conclusion?
There is convincing statistical evidence that the average time to swim a lap with the freestyle stroke is less than the average time to swim a lap with the butterfly stroke.
There is convincing statistical evidence that the average time to swim a lap with the freestyle stroke is different from the average time to swim a lap with the butterfly stroke
There is not convincing statistical evidence that the average time to swim a lap with the freestyle stroke is greater than the average time to swim a lap with the butterfly stroke.
There is not convincing statistical evidence that the average time to swim a lap with the freestyle stroke is different from the average time to swim a lap with the butterfly stroke.
There is not convincing statistical evidence that the average time to swim a lap with the freestyle stroke is less than the average time to swim a lap with the butterfly stroke.
A biologist studied the frequency of croaks for frogs from two different regions. From a random sample of 32 frogs located in the northern region, the mean number of croaks per hour was 21.3, and from a random sample of 38 frogs located in the southern region, the mean number of croaks per hour was 28.9. To estimate the difference in the mean number of croaks (southern minus northern), a 95 percent confidence interval was constructed from the samples. The interval was reported as (7.1,8.1).
Which of the following claims is supported by the interval?
All southern frogs croak more times per hour than do all northern frogs.
The northern frogs are likely to have a greater mean number of croaks per hour than the southern frogs.
The southern frogs are likely to have a greater mean number of croaks per hour than the northern frogs.
All frogs in the study have about the same number of croaks per hour.
The northern and southern frogs have the same mean number of croaks per hour.
A consumer group studied two different manufacturers of cars, J and K, to investigate differences in gas mileage for cars made by the two manufacturers. For a similar type of car, a random sample of 15 cars from J and a random sample of 12 cars from K were selected, and the gas mileages, in miles per gallon (mpg), were recorded. The difference in the sample mean gas mileages was used to construct the 90 percent confidence interval (3.5,5.7).
Assuming all conditions for inference were met, which of the following is a correct interpretation of the interval?
The probability is 0.90 that the difference in sample means for gas mileage for the two car manufacturers is between 3.5 mpg and 5.7 mpg.
The probability is 0.90 that the population mean difference in gas mileage for the two car manufacturers is between 3.5 mpg and 5.7 mpg.
About 90 percent of the differences in gas mileage for the two car manufacturers are between 3.5 mpg and 5.7 mpg.
We are 90 percent confident that the difference in sample means for gas mileage for the two car manufacturers is between 3.5 mpg and 5.7 mpg.
We are 90 percent confident that the population mean difference of gas mileage for the two car manufacturers is between 3.5 mpg and 5.7 mpg.
A 99 percent confidence interval for a difference in means was given as 25.1±4.3.
Assuming all conditions for inference were met, which of the following is a correct interpretation of the 99 percent confidence level?
In repeated samples of the same size, approximately 99 percent of the intervals constructed from the samples will extend from 20.8 to 29.4.
In repeated samples of the same size, approximately 99 percent of the sample means will fall between 20.8 and 29.4.
In repeated samples of the same size, approximately 99 percent of the samples will fall between 20.8 and 29.4.
In repeated samples of the same size, approximately 99 percent of the intervals constructed from the samples will capture the difference in sample means.
In repeated samples of the same size, approximately 99 percent of the intervals constructed from the samples will capture the difference in population means.
Researchers investigated whether there is a difference between two headache medications, R and S. Researchers measured the mean times required to obtain relief from a headache for patients taking one of the medications. From a random sample of 75 people with chronic headaches, 38 were randomly assigned to medication R and the remaining 37 were assigned to medication S. The time, in minutes, until each person experienced relief from a headache was recorded. The sample mean times were calculated for each medication.
Have the conditions been met for inference with a confidence interval for the difference in population means?
Yes, all conditions have been met.
No, because the data were not collected using a random sample.
No, because cause and effect cannot be inferred since there is a random sample.
No, because the sample sizes are not large enough to assume the distribution of the difference in sample means is approximately normal.
No, because the sample sizes are not the same.
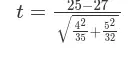
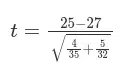
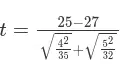
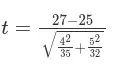
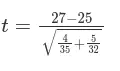
A two-sample t-test for a difference in means will be conducted to investigate whether the average length of a cell phone call is shorter this year compared with 5 years ago. From a random sample of 35 phone call records this year, the average length was 25 minutes with a standard deviation of 4 minutes. From a random sample of 32 phone call records from 5 years ago, the average length was 27 minutes with a standard deviation of 5 minutes. The difference (this year minus five years ago) in means will be calculated.
With a null hypothesis of no difference in length, which of the following is a correct test statistic for the test?
A soda manufacturer claims that its Cherry Fizz soda has more carbonation than a competitor’s Cherry Eclipse soda. Bottles of both types of soda are opened, covered with a balloon, and then shaken. The diameter of each balloon is then measured. The mean balloon diameters are 2.3 inches for the Cherry Fizz soda and 2.1 inches for the Cherry Eclipse soda. A 90 percent confidence interval to estimate the difference in mean diameters, in inches, is (−0.8,1.2). Which of the following claims is supported by the interval?
Because 2.3 inches is larger than 2.1 inches, the manufacturer is correct, and Cherry Fizz has more carbonation.
Because the interval has more positive values than negative values, Cherry Fizz has more carbonation.
Because 2.3 and 2.1 are very similar, there is no difference in the mean carbonation levels
The interval cannot be interpreted because negative measurements are not possible.
Because the interval contains 0, it is possible that there is no difference in mean carbonation levels.
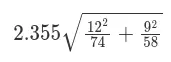
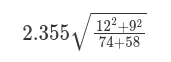
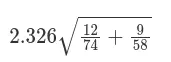
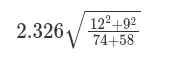
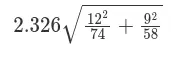
The management of a large hardware store is interested in estimating the difference between the mean dollar amount of purchases made by customers who use the store’s credit card and the mean dollar amount of purchases made by customers who use a different credit card. A random sample of 74 customers who used the store’s credit card showed a mean purchase of $107 with a standard deviation of $12. A separate random sample of 58 customers who used a different credit card showed a mean purchase of $132 with a standard deviation of $9. Technology was used to calculate that the correct number of degrees of freedom is 129.78.
Which of the following represents the margin of error for a 98 percent confidence interval to estimate the difference in the mean purchase amount for the two types of credit cards?
The weekly sales at two movie theaters were recorded for a random sample of 25 weeks. A 95 percent confidence interval for the difference in mean weekly sales for the two movie theaters was calculated as ($1,288,$2,586).
With all else remaining constant, which of the following would have resulted in a confidence interval narrower than the calculated interval?
A sample size less than 25
A sample size greater than 25
An increase to 99 percent confidence
A sample mean greater than $1,937
A sample mean less than $1,937
Random samples of players for two types of video games were selected, and the mean number of hours per week spent playing the games was calculated for each group. The sample means were used to construct the 90 percent confidence interval (1.5,3.8) for the difference in the mean number of hours per week spent playing the games.
The maker of one of the video games claims that there is a difference in the population mean number of hours per week spent playing the two games. Is the claim supported by the interval?
Yes, because 0 is not contained in the interval.
Yes, because the midpoint of the interval is greater than 1.
Yes, because the margin of error for the estimate is less than 1.
No, because the margin of error for the estimate is greater than 1.
No, because 0 is not contained in the interval.
Anne claims that a store-brand fertilizer works better than homemade compost as a soil enhancement when growing tomatoes. To test her theory, she plants two tomato plants in each of five planters. One plant in each planter is grown in soil with a store-brand fertilizer and the other plant is grown in soil with homemade compost, with the choice of soil chosen at random. In three months, she will harvest and weigh the tomatoes from each plant. Which of the following is the correct confidence interval Anne should use to analyze the data?
Two sample z interval for μ1−μ2
Paired z interval for μdiff
Two sample t interval for μ1−μ2
Paired t interval for μdiff
The correct interval cannot be determined without the data
The weights (in pounds) of three adult males are 160, 215, and 195. What is the standard error of the mean for these data?
190
27.84
22.73
16.07
13.13
You want to compute a 90% confidence interval for the mean difference in height for mothers and their adult daughters using a random sample of 30 mothers who have an adult daughter. What critical value should you use for this interval?
1.645
1.671
1.697
1.699
1.761
In a two-sample hypothesis test with independent samples...
...one sample is used to obtain an estimate, the other sample is used to test a hypothesis.
...each sample is used to perform a hypothesis test and the best of the two answers is used.
...a comparison is done of the same parameter in two separate populations.
...a joint hypothesis test of the population mean and population variance is done.
A retail company is investigating whether to use a line (X) or square (Y) barcode with its new automatic checkout system. Which of the following hypotheses compares the proportion (p) of checkout failures for each type of barcode?
H0: pX = pY H1: pX = pY
H0: pX=0.5, pY = 0.5 H1: pX =0.5, pY =0.5
H0: pX>0.5, pY≤0.5 H1: pX ≤0.5, pY > 0.5
H0: pX > 0.5, pY > 0.5 H1: pX ≤0.5, pY ≤0.5
True or False:
50 heights of women from Texas and 50 heights of women from Oregon are considered matched pair (dependent) sample data sets.
True
False
True or False:
Weights of 40 women recorded before starting a diet and 6 months after starting a diet are considered matched pair (dependent) sample sets.
True
False
What distribution do we use when testing claims about population proportions?
F
z
t
Chi
What distribution do we use when testing claims about population means?
F
Z
t
Chi

Researchers claim that a blue background enhances creativity based on the average scores below. Test the claim at a 1% significance level.
P = .0021
We are more creative with blue.
P = 0.9979
We are more creative with blue.
P = .0021
We are more creative with red.
P = 0.9979
There appears to be no difference.
Tatiana wonders if the same proportion of teens and adults check social media at least once per day. She wants to obtain a random sample of people from each group to test if there is a significant difference between the proportion of teens and adults that check social media at least once per day.


Caroline thinks she can flip a coin so it lands showing heads more often with her right hand. She flipped a coin 40 times with each hand. She wants to test whether she gets more heads with her right hand than her left hand. (Assume all conditions have been met.)
Which of the following would be an appropriate test statistic for their test?


A political consultant wondered if support for a candidate was significantly different between men and women. The consultant surveyed a random sample of voters.
The consultant wants to test if these results suggest a significant difference in support between men and women. Assume that all conditions have been met.
Which of the following would be an appropriate test statistic for their test?


A sociologist took a random sample of 1200 drivers and found that 59 of the 610 men in the sample had received a speeding ticket, while 28 of the 590 women in the sample had received a speeding ticket.
What can the sociologist conclude?
There is sufficient evidence to show that there is a difference between proportions.
There is insufficient evidence to show that there is a difference between proportions.
There is sufficient evidence to show that there is no difference between proportions.
There is insufficient evidence to show that there is no difference between proportions.
Jillian is an analyst for a ride sharing app that connects users with drivers. She wonders if drivers in Dallas are more or less likely to cancel rides than drivers in Houston. She takes a random sample of 1000 rides from Dallas and finds that 30 were cancelled. A random sample of 1000 rides from Houston shows 24 cancelled rides.
She used these results to test whether there is a difference in the proportion of cancelled rides between the two cities. The test statistic was z = 0.83 and the P-value was approximately 0.41.
At the α = 0.01 level of significance, is there sufficient evidence to conclude that the proportion of cancelled rides is different between the two cities?
Yes, since the P-value is greater than 0.01.
Yes, since the test statistic is greater than 0.01.
No, since the P-value is greater than 0.01.
No, since the test statistic is greater than 0.01.

Sanjay is researching if female students are more or less likely than male students to have received extra credit at a large university. He takes a random sample of 300 students.
Sanjay used this sample to build a 95% confidence interval to estimate the difference between the proportion of females and males receiving extra credit. The resulting interval was 0.05 ± 0.07.
Based on the interval, what do we know about the corresponding P-value and conclusion at the α = 0.05 level of significance?
The P-value is less than α = 0.05, and he cannot conclude that there is a difference between the proportions.
The P-value is less than α = 0.05, and he should conclude that there is a difference between the proportions.
The P-value is greater than α = 0.05, and he cannot conclude that there is a difference between the proportions.
The P-value is greater than α = 0.05, and he should conclude that there is a difference between the proportions.
A city used to require mailed payments for parking tickets. City officials piloted a system that allowed people to choose between paying by mail or paying online. They were curious if giving people both payment options would result in fewer unpaid parking tickets. To test the new system, each parking ticket one month was printed with either a "mail only" payment option or both payment options (mail and online). Officers flipped a coin to determine which message was printed on each ticket.
The results of the study produced a test statistic of z = -2.90 and P-value of approximately 0.002. Assume that all conditions for inference were met.
At the α = 0.01 level of significance, is there sufficient evidence to conclude that the proportion of unpaid tickets is lower when both payment options are offered?
Yes, since the P-value is less than 0.01.
Yes, since the test statistic is less than 0.01.
No, since the P-value is less than 0.01.
No, since the test statistic is less than 0.01.

Two pain relief medicines are tested on volunteer post-operation patients, randomly assigned to one of the two brands of medicine, as to whether or not mean duration of relief are different. Data is recorded in minutes of pain relief. What is the conclusion of the appropriate hypothesis test for this experiment?
P < .05 so reject Ho.
P < .05 so fail to reject Ho.
P > .05 so reject Ho.
P > .05 so fail to reject Ho.
5% significance level is inappropriate for medical decisions.
It is thought that the average penny is older than the average quarter. The average age of a sample of 50 pennies was 8.72 years with a s = 0.73 years and the average age of 50 quarters was 6.78 years with a s = 0.99 years.
A Keebler sales rep claims that there are more chocolate chips in their cookie than in Chips Ahoy cookies. You take a random sample of 20 Keebler cookies and find an average of 15.8 chips per cookie and a s = 3.7 chips. A random sample of 25 Chips Ahoy yields 14.2 chips per cookie and s = 4.3 chips. What is the conclusion of the test?
There is enough evidence to reject the claim that there are more chips in Keeblers.
There is not enough evidence to reject the claim that there are more chips in Keeblers.
There is enough evidence to support the claim that there are more chips in Keeblers.
There is not enough evidence to support the claim that there are more chips in Keeblers.

Ha: The mean number of days 9th grade students absent is less than the mean number of days 12th grade students are absent.
Ha: The mean number of days 12th grade students absent is equal to the mean number of days 9th grade students are absent.
Ha: The mean number of days 9th grade students absent is greater than the mean number of days 12th grade students are absent.
Ha: The mean number of days 12th grade students absent is less than the mean number of days 9th grade students are absent.

A market researcher suspects that employees at Company A were older on average than employees at company B. They obtained a random sample of employees ages from each company. Results are shown. Which is the correct calculation for the t-statistic?


A health researcher was curious if women in India lived longer on average than men in India. They obtained data from a random sample of 216 records of people in India. Results are shown. What is the P-value?
0.00526
-2.58
2.58
0.0152

120 Brand X oil filters and 90 Brand Y oil filters were tested for milligrams of residue, with the following results. Find a 95% confidence interval for μY - μX.
(0.96, 1.44)
B) (0.92, -0.96)
C) (-1.44, -0.96)
D) (-1.84, -0.56)
E) (0.92, 1.48)
A survey was conducted to determine the difference in gasoline mileage for two types of trucks. A random sample was taken for each model of truck, and the mean gasoline mileage, in miles per gallon, was calculated. A 98% confidence interval for the difference in the mean mileage for model A trucks and the mean mileage for model B trucks, μA - μB was determined to be (2.6, 4.5)
Based on this sample, we are 98% confident that the average mileage for model B trucks is between 2.6 and 4.5 miles per gallon higher than the average mileage for model A trucks.
We know that 98% of model A trucks get mileage that is between 2.6 and 4.5 miles per gallon higher than model B trucks.
Based on this sample, we are 98% confident that the average mileage for model A trucks is between 2.6 and 4.5 miles per gallon higher than the average mileage for model B trucks.
We are 98% confident that a randomly selected model A truck will get mileage that is between 2.6 and 4.5 miles per gallon higher than a randomly selected model B truck.
We know that 98% of all random samples done on the population of trucks will show that the average mileage for model A trucks is between 2.6 and 4.5 miles per gallon higher than the average mileage for model B trucks.

A researcher was interested in comparing the salaries of female and male employees of a particular company. Independent random samples of 8 female employees (column 1) and 15 male employees (columns 2&3) yielded the following weekly salaries (in dollars). Determine a 98% confidence interval for the difference, μ1 - μ2 between the mean weekly salary of all female employees and the mean weekly salary of all male employees.
(-$385, $164)
(-$158, $382)
(-$335, $111)
(-$431, $208)
E) (-$382, $158)
A philosophy professor wants to find out whether the mean age of the men in his large lecture class is equal to the mean age of the women in his classes. After collecting data from a random sample of his students, the professor tested the hypothesis H0: μM = μW against the alternative HA: μM ≠ μW. The P-value for the test was 0.003. Which is true?
It is very unlikely that the professor would see results like these if the mean age of men was equal to the mean age of women.
There is a 0.3% chance that the mean ages for the men and women are equal.
There is a 99.7% chance that another sample will give these same results.
There is a 0.3% chance that another sample will give these same results.
There is a 0.3% chance that the mean ages for the men and women are different.
A Pew Research Center poll asked independent random samples of working women and men how much they value job security. Of the 806 women, 709 said job security was very or extremely important, compared with 802 of the 944 men surveyed. Calculate a 95% confidence interval for the difference in the proportions.
(-0.002, 0.062)
(0.002, 0.062)
(0.003, 0.056)
(0.216, 0.272)
Thirty five people from a random sample of 125 workers from Company A admitted to using sick leave when they weren't really ill. Seventeen employees from a random sample of 68 workers from Company B admitted that they had used sick leave when they weren't ill. Which of the following is a 95% confidence interval for the difference in the proportions?
0.03±125(0.28)(0.72)+68(0.25)(0.75)
0.03±1.96125(0.28)(0.72)+68(0.25)(0.75)
0.03±1.96125(0.28)(0.72)−68(0.25)(0.75)
57±1.96125(0.28)(0.72)+68(0.25)(0.75)
At a baseball game, 42 of 65 randomly selected people own an iPod. At a rock concert occurring at the same time across town, 34 of 52 randomly selected people own an iPod. A researcher wants to test the claim that the proportion of iPad owners at the two venues is different. A 90% confidence interval for the difference in population proportions is (-0.154, 0.138). Which of the following gives the correct outcome of the claim?
Because the interval includes 0, the researcher can conclude that the proportion of iPod owners at the two venues is the same
Because the center of the interval is -0.008, the researcher can conclude that a higher proportion of people at the rock concert own iPods than at the baseball game.
Because the interval includes 0, the researcher cannot conclude that the proportion of iPod owners at the two venues is different.
Because the interval includes -0.008, the researcher cannot conclude that the proportion of iPod owners at the two venues is different.
When constructing a confidence interval for a difference between two population proportions, why is it important to check that the number of successes and the number of failures in each sample is at least 10?
So we can generalize the results to the populations from which the samples were selected.
So we can assume that the two samples are independent.
So we can assume that the observations within each sample are independent.
So we can assume the sampling distribution of p1-p2 is approximately Normal.
So we can assume that the populations 1 and population 2 are approximately Normal.


Experiments on learning in animals sometimes measure how long it takes mice to find their way through a maze. The mean time is 18 seconds for one particular maze. A researcher thinks that a loud noise will cause the mice to complete the maze faster. She measures how long each of 10 mice takes with a noise as a stimulus. The sample mean is x = 16.5 seconds. What is the alternative hypothesis for the test of significance?
H0: μ =18 vs. HA : μ =18
H0: μ =18 vs. HA : μ <18
H0: μ =18 vs. HA : μ >18
H0: μ <18 vs. HA : μ =18
H0: μ =18 vs. HA : μ =18
You are thinking of conducting a one-sample t-test about a population mean μ using a 0.05 significance level. Which of the following statements is correct?
You should not carry out the test if the sample does not have a Normal distribution
You can safely carry out the test if there are no outliers, regardless of the sample size
You can carry out the test if a graph of the data shows no strong skewness, regardless of the sample size.
You can carry out the test only if the population standard deviation is known
You can safely carry out the test if your sample size is at least 30
A 95% confidence interval for μ based on n=15 observations from a normal population is ( -0.73, 1.92 ) If we use this confidence interval to test the hypothesis H0 : μ=0 vs. HA : μ=0 , which of the following is the most appropriate conclusion?
Reject H0 at the α = 0.05 level of significance
Fail to Reject H0 at the α = 0.05 level of significance
Reject H0 at the α = 0.10 level of significance
Fail to Reject H0 at the α = 0.10 level of significance
We cannot perform the required test since we do not know the value
Which of the following has the smallest probability
P(t>2) if t has 5 df
P(t>2) if t has 2 df
P(z>2)
P(t<2) if t has 5 df
P(t<2) if t has 2 df
A study of road rage asked random samples of 596 men and 523 women about their behavior while driving. Based on their answers, each person was assigned a road rage score on a scale of 0 to 20. Are the conditions for performing a two-sample t-test satisfied?
Maybe, we have independent random samples, but we should look at the data to check Normality.
No, road rage scores on a scale from 0 to 20 can't be Normal
No, we don't know the population standard deviations.
Yes, the large sample sizes guarantee that the corresponding population distribution will be Normal.
Yes, we have tow independent random sample and large sample size.
A significance test was performed to test H0: μ=2 vs. HA: μ=2. A sample of size 28 produced a standardized test statistic of t =2.051. Assuming all conditions for inference were met, which of the following intervals contains the P-value for this test?
0.01 < P < 0.02
0.02 < P < 0.025
0.025 < P < 0.05
0.05 < P < 0.10
P > 0.10
A government statistician claims that the mean income level of families living in subsidized housing is $9,250 with a standard deviation of $2,575. A reporter plans to test this claim through interviews with a random sample of 50 families. If she finds a sample mean more than $500 different from the claimed $9,250, she will dispute the statistician's claim. What is the probability that the reporter will mistakenly reject a true claim?
0.043
0.085
0.170
0.830
0.915
A guidance counselor is interested in comparing GPAs of students with home access to the Internet with students who do not have this access. She pulls the files of an SRS of ten students who do have home access to the Internet and an SRS of ten who do not, and proceeds to run a t-test to compare the mean GPAs of each group. Which of the following is a necessary assumption?
The population standard deviations from each group are known.
The population standard deviations from each group are equal.
The samples must be independent samples, and for each sample np and n(1 - p) must both be at least 10.
The population standard deviations from each group are unknown.
The population of GPA scores from each group is normally distributed.
A researcher wished to compare the average amount of time spent in extracurricular activities by high school students in a suburban school district with that in a school district of a large city. The researcher obtained an SRS of 60 high school students in a large suburban school district and found the mean time spent in extracurricular activities per week to be 6 hours with a standard deviation of 3 hours. The researcher also obtained an independent SRS of 40 high school students in a large city school district and found the mean time spent in extracurricular activities per week to be 5 hours with a standard deviation of 2 hours. Suppose that the researcher decides to carry out a significance test of
H0 : μsuburban=μcity vs a two−sided alternative
Which is the correct standardized test statistic?
z=(603+402)(6−5)−0
z=(6032+4022)(6−5)−0
z=603+402(6−5)−0
t=(603+402)(6−5)−0
t=(6032+4022)(6−5)−0
A researcher wished to compare the average amount of time spent in extracurricular activities by high school students in a suburban school district with that in a school district of a large city. The researcher obtained an SRS of 60 high school students in a large suburban school district and found the mean time spent in extracurricular activities per week to be 6 hours with a standard deviation of 3 hours. The researcher also obtained an independent SRS of 40 high school students in a large city school district and found the mean time spent in extracurricular activities per week to be 5 hours with a standard deviation of 2 hours. Suppose that the researcher decides to carry out a significance test of
H0 : μsuburban=μcity vs a two−sided alternative
The P-value for the test is 0.048. A correct conclusion is to
Fail to reject Ho since 0.048 < 0.05 There is convincing evidence of a difference in the average time spent on extracurricular activities by students in the suburban and city school districts.
Fail to reject Ho since 0.048 < 0.05 There is not convincing evidence of a difference in the average time spent on extracurricular activities by students in the suburban and city school districts.
Fail to reject Ho since 0.048 < 0.05 There is convincing evidence that average time spent on extracurricular activities by students in the suburban and city school districts is the same.
Reject Ho since 0.048 < 0.05 There is not convincing evidence of a difference in the average time spent on extracurricular activities by students in the suburban and city school districts.
Reject Ho since 0.048 < 0.05 There is convincing evidence of a difference in the average time spent on extracurricular activities by students in the suburban and city school districts.
The weighs (in pounds) of three adult males are 160, 215, and 195. What is the standard error of the mean for these data?
190
27.84
22.73
16.07
13.13
Are TV commercials louder than their surrounding programs? To find out, researchers collected data on 50 randomly selected commercials in a given week. With the television's volume at a fixed setting, they measured the maximum loudness of each commercial and the maximum loudness in the first 30 seconds of regular programming that followed. Assuming the conditions for inference are met, the most appropriate method for answering the question of interest is
a two-sample t-test for a difference in means.
a two-sample t-interval for difference in means.
a paired t-test for a mean difference.
a two-sample z-test for a difference in proportions.
a paired t-interval for mean difference.
Researchers are interested in evaluating the effect of a natural product on reducing blood pressure. They plan to carry out a randomized experiment to compare the mean reduction in blood pressure of a treatment (natural product) group and a placebo group. Then they will use the data to perform a test of
H0: μT−μP = 0 vs H0: μT−μP > 0
where μT = the true mean reduction in blood pressure when taking the natural product and μP = the true mean reduction in blood pressure when taking a placebo product for subjects like the ones in the experiment. The researcher would like to detect whether the natural product reduces blood pressure by at least 7 points more, on average, than the placebo. If groups of size 50 are used in the experiment, a two-sample t-test using α=0.01 will have a power of 80% to detect a 7-point difference in mean blood pressure reduction. If the researchers want to be able to detect a 5-point difference instead, then the power of the test
would be less than 80%.
would be greater than 80%
would still be 80%
could be either less than or greater than 80%
would vary depending on the standard deviation of the data.
A quiz question gives random samples of n = 10 observations from each of two Normally distributed populations. Tom uses a table of t distribution critical values and 9 degrees of freedom to calculate a 95% confidence interval for the difference in the two population means. Janelle uses her calculator’s two-sample t interval with 16.87 degrees of freedom to compute the 95% confidence interval. Assume that both students calculate the intervals correctly. Which of the following is true?
Tom's confidence interval is wider
Janelle's Confidence interval is wider
Both confidence interval are the same width
There is insufficient information to determine which confidence interval is wider.
Janelle made a mistake; degrees of freedom has to be a whole number.
Anne claims that a store-brand fertilizer works better than homemade compost as a soil enhancement when growing tomatoes. To test her theory, she plants two tomato plants in each of five planters. One plant in each planter is grown in soil with store-brand fertilizer and the other plant is grown in soil with homemade compost, with the choice of soil determined at random. In three months, she will harvest and weigh the tomatoes from each plant. Which of the following is the correct confidence interval Anne should use to analyze these data?
Two sample z interval for μ1−μ2
Paired z interval for μdiff
Two sample t-interval for μ1−μ2
Paired t interval for μdiff
The correct interval cannot be determined without the data.
You want to compute a 90% confidence interval for the mean difference in height for mothers and their adult daughters using a random sample of 30 mothers who have an adult daughter. What critical value should you use for this interval?
1.645
1.671
1.697
1.699
1.761
We want to construct a one-sample t-interval for a population mean using data from a population with an unknown shape. In which of the following circumstances would it be inappropriate to construct the interval based on an SRS of size 14 from the population?
A stem-plot of the data is roughly bell shaped.
A histogram of the data shows slight skewness.
A box-plot shows that the values above the median are much more variable than the values below the median.
The sample standard deviation is large.
The sample standard deviation is small.
A 90% confidence interval for the mean μ of a population is computed from a random sample and is found to be 90±30 . Which of the following could be the 95% confidence interval based on the same data?
90±21
90±30
90±39
90±70
without knowing the sample size, any of the above answer could be the 95% confidence interval
Do high school seniors with part-time jobs spend less time doing homework per week, on average, than seniors without part-time jobs? For a random sample of 45 seniors with part-time jobs, the mean amount of homework time is 4.2 hours with a standard deviation of 3.8 hours. For a random sample of 45 seniors without part time jobs, the mean amount of homework time is 5.8 hours with a standard deviation of 4.9 hours. Assuming the conditions are met, which of the following is the correct standard error for a 95% confidence interval for a difference in the population means?
454.92−453.82
454.92+453.82
45(4.9−3.8)
455.82−454.22
455.82+453.82
Few people enjoy melted ice cream. Being from the sunny state of Arizona, Megan and Jenna decided to test if generic vanilla ice cream melts faster than Breyers vanilla ice cream. At 10 different times during the day and night, the girls put a single scoop of each type of ice cream in the same location outside and timed how long it took for each scoop to melt completely. When constructing a paired t interval for a mean difference using these data, which of the following distributions should Megan and Jenna check for Normality?
I. The distribution of melt time for the generic ice cream
II. The distribution of melt time for the Breyers ice cream
III. The distribution of difference in melt time
I only
II only
III only
I and II
I, II, and III
A medical assistant sampled the blood pressures of 20 randomly selected patients with high blood pressure before and after they receive a dose of a new medicine. Which hypothesis test should she run?
Paired t-test. Since the patients are the same in both sample 1 and sample 2, the two samples are linked.
2-sample t-test. Since the blood pressures were taken for 20 patients in sample 1 and the same 20 patients in sample 2, use a two-sample t-test to see if the results are statistically significant.
1-sample t-test. The medical assistant should compare the mean of the first sample of 20 patients to the mean of the second sample of 20 patients.
2-sample t-test. There is no natural pairing between the two samples.
A researcher gave one group of people an active drug and gave a different group of people an inactive placebo, then compare the blood pressures between the groups. Which test should he run to determine the efficacy of the active drug?
Paired t-test. Since there is a group with the active drug and another with the inactive drug, he may pair the two two groups if the sample sizes are the same.
2-sample t-test. Since the blood pressures were taken for patients in sample 1 and different patients in sample 2, use a two-sample t-test to see if the results are statistically significant.
1-sample t-test. The researcher should compare the mean of the first sample of patients to the mean of the second sample of patients.
2-sample z-test. There is no natural pairing between the two samples, so the researcher must use a proportions test.
Is the mean height of female college students greater than 5.5 feet?
Paired t-test. Students heights can be measured against females of similar backgrounds.
1-sample t-test. Test whether the mean of a single sample is equal to the target value of 5.5 feet.
2-sample t-test. Test whether the heights of female college students is higher than their high school heights.
Use a z-test by finding the mean height and standard deviation of the sample of college females' heights.
Does the mean height of female college students significantly differ from the mean height of male college students?
Paired t-test. Test whether the difference of the means of one male paired with one female is equal to 0.
2-sample t-test. Test whether the mean height of female college students is different than the mean height of male college students.
1-sample t-test. Test whether the mean of randomly assigned pairs of female and male students is greater than the mean of the average of males and females.
z-test. Use proportions in place of means to run a one sample z-test for males and females and compare averages.
If you measure the weight of male college students before and after each subject takes a weight-loss pill, is the mean weight loss significant enough to conclude that the pill works?
Paired t-test. Test whether the mean of the differences in weights between the male college students before they took the weight-loss pill and after they take the weight loss is significant to conclude the pill works.
1-sample t-test. Test if the mean weight of the males before the study is different from the mean of the males weight after the weight-loss pill was taken.
2-sample t-test. Compare the mean weights of the males both before and then after the weight-loss pill is taken to see if there is a decrease in weight between the groups overall.
z-test. This is a proportion and should be tested using a one-sample z-test.
The fire department of a small city wants to know if the proportion of homes having at least one smoke detector is still 90%. They take a sample of 100 homes and check if they have working smoke detectors.
Paired t-test. The homes surveyed can be compared with the 90% and determined if the difference in the homes with smoke detectors now is equal to zero.
1-sample t-test. This is a single sample of the mean estimated number of homes having smoke detectors.
2-sample t-test. Since the population value before was 90%, compare this to the current population and determine if the difference is 0 between before and now.
1-sample z-test. Since this is a proportion so we should use a z-test to see if the homes sampled still equal the current rate of 90% in this city.
I run a paired t-test for 15 sets of first grade twins reading abilities if one twin used a computer program tutor and the other did not, and get a p-value of 0.02, what does this mean for a significance level of 0.05?
Reject the null hypothesis. There is evidence at the 0.05 level that the computer program tutor is more effective at raising reading scores.
Fail to reject the null hypothesis. There is no evidence at the 0.05 level that the computer program tutor is more effective at raising reading scores.
Accept the null hypothesis. There is evidence at the 0.05 level that the computer program tutor is more effective at raising reading scores.
This was not the proper use of a paired t-test; no conclusions can be drawn from this test.
We use a paired t-test for 18 students in the Bethel AP statistics class and 18 students in the Kecoughtan class to see if one teacher has higher scores on the AP exam than another.We get a p-value of 0.14. What should we conclude?
Reject the null hypothesis. There is evidence at the 0.05 level that the one teacher has higher scores than another.
Fail to reject the null hypothesis. There is no evidence at the 0.05 level that one teacher has higher scores than another.
Accept the null hypothesis. There is evidence at the 0.05 level that one teacher's scores are higher than the other teacher's.
This was not the proper use of a paired t-test; no conclusions can be drawn from this test.
A manufacturer of gloves wants to determine if a special type of wool gloves lasts longer than the cotton gloves they manufacture. He makes pairs of gloves in which the left hand is cotton and the right hand is wool. We sample 24 women who wear these pairs of gloves, then use a paired t-test to find the mean of the differences in wear between the right glove and left glove; we get a p-value of 0.043. At the 0.05 level, what should we conclude?
Reject the null. There is evidence at the 0.05 significance level that the wool gloves lasts longer than the cotton glove.
Fail to reject the null. There is evidence at the 0.05 significance level that the wool glove lasts longer than the cotton glove.
Fail to reject the null. There is no evidence at the 0.05 significance level that the wool glove lasts longer than the cotton glove.
We cannot conclude anything because a paired t-test was not the appropriate test to run for this sample.
A random sample of 85 sixth-graders in a large city take a course designed to improve scores on a reading comprehension test. Based on this sample, a 90% confidence interval for the mean improvement in test scores for all sixth-graders in the city taking this course is found to be (12.6, 14.8). Which of the following are the sample mean and margin of error on which this interval is based?
Sample Mean = 13.7; Margin of Error = 1.1
Sample mean = 13.7; Margin of Error = 2.2
Sample mean is unknown; Margin of Error = 1.1
Sample mean is unknown; Margin of Error = 2.2
A random sample of 85 sixth-graders in a large city take a course designed to improve scores on a reading comprehension test. Based on this sample, a 90% confidence interval for the mean improvement μ in test scores for all sixth-graders in the city taking this course is found to be (12.6, 14.8). Which one of the following is a correct interpretation of this confidence interval?
Ninety percent of the 85 sixth-graders taking this course in the sample improved their reading comprehension scores by 12.6 to 14.8 points.
The probability is 0.90 that the true mean improvement in reading comprehension for sixth-graders taking this course is between 12.6 and 14.8 points.
We are 90% confident that the true improvement in reading comprehension scores of all sixth-graders taking this course is between 12.6 and 14.8 points.
We are 90% confident that the true improvement in reading comprehension scores of these 85 sixth-graders is between 12.6 and 14.8 points.
Agricultural researchers plant 100 plots with a new variety of corn and measure the mean yield for these plots in bushels per acre. They treat the 100 plots as a simple random sample of possible plots of corn (as researchers often do) and report a 95% confidence interval for the mean corn yield of (128.4, 131.6) bushels per acre. Which of the following is a correct interpretation of the 95% confidence level?
We are 95% confident that the true mean yield for this new variety of corn is captured by the interval (128.4, 131.6) bushels per acre.
If many intervals were constructed this way from many independent sets of 100 plots, 95% of the intervals would capture the true mean corn yield.
If many intervals were constructed this way from many independent sets of 100 plots, 95% of the time the true mean corn yield would be in the interval (128.4, 131.6) bushels per acre.
Simple random samples are taken from two large populations, designated Population 1 and Population 2. Which of the following describes a situation in which the conditions for performing a two-sample t-test for the difference of two means for these populations have NOT been satisfied?
n1 = 15, n2 = 100. The distribution of Sample 1 is symmetric and bell-shaped with no outliers, and the distribution of Sample 2 is skewed left with a small outlier.
n1 = 15, n2 = 15. The distributions of both samples are symmetric and bell-shaped with no outliers.
n1 = 15, n2 = 15. The distribution of Sample 1 is symmetric and bell-shaped with no outliers, and the distribution of Sample 2 is skewed left with a small outlier.
A sports physiologist wishes to compare the effects of two stepping heights (low and high) on heart rate in a step-aerobics workout. A sample of 50 adults in roughly similar physical condition was randomly divided into two groups of 25 subjects each. Group 1 did a standard step-aerobics workout using the low stepping height. The sample mean heart rate at the end of Group 1's workout was 90 beats per minute (bpm), with a sample standard deviation of 9 bpm. Group 2 did the same workout but used the high stepping height. The sample mean heart rate at the end of Group 2's workout was 95.1 bpm, with a sample standard deviation of 12 bpm. Assume that conditions for inference have been met. Let μ1and μ2 represent the mean heart rates we would observe for the entire population of interest if all members of the population did the workout using the low and high stepping height, respectively. Suppose that the researcher wishes to test the hypotheses H0 : μ1 - μ2 = 0 versus Ha : μ1 - μ2 < 0. Which of the following is a correct expression for calculating the test statistic for this test?


A study reports that 75 percent of young adults in a county get their news from online sources. A sociologist
believes that the percentage is actually greater than 75 percent. The sociologist will select a random sample of young adults from around the county to interview. Which of the following is the most appropriate method for investigating the sociologist’s belief?
A one-sample z-test for a difference in population proportions
A one-sample z-ztest for a sample proportion
A one-sample -z test for a population proportion
A two-sample -z test for a difference in population proportions
A two-sample -z test for a difference in sample proportions
A random sample of 100 people from Country S had 15 people with blue eyes. A separate random sample of 100
people from Country B had 25 people with blue eyes. Assuming all conditions are met, which of the following is a
95 percent confidence interval to estimate the difference in population proportions of people with blue eyes
(Country S minus Country B) ?
(-0.01, 0.21)
(-0.15,-0.05)
(-0.19,-0.01)
(-0.21, 0.01)
(-0.24,0.04)

A wildlife biologist is doing research on chronic wasting disease and its impact on the deer populations in Colorado. To estimate the difference between the proportions of deer with chronic wasting disease in two different
regions, a random sample of 200 deer was obtained from one region and a random sample of 197 deer was obtained
from the other region. The biologist checked for the following (see pic). Which of the following conditions for inference was the biologist checking?
The population of deer within each region is approximately normal.
It is reasonable to generalize from the samples to the populations.
The samples are independent of each other.
The observations within each sample are close to independent.
The sampling distribution of the difference in sample proportions is approximately normal.
A random sample of 240 adults over the age of 40 found that 144 would use an online dating service. Another
random sample of 234 adults age 40 and under showed that 131 would use an online dating service. Assuming all
conditions are met, which of the following is the standard error for a 90 percent confidence interval to estimate the
difference between the population proportions of adults within each age group who would use an online dating
service?
240240144(1−240144)+234234131(1−234131)
1.65240240144(1−240144)+234234131(1−234131)
1.96240240144(1−240144)+234234131(1−234131)
474474275(1−474275)
1.65474474275(1−474275)
A marketing executive is investigating whether this year’s advertising campaign has resulted in greater mean sales
compared with last year’s mean sales. The executive collects a random sample of 100 customer orders from a large
population of orders and calculates the sample mean and sample standard deviation. Which of the following is the appropriate test for the executive’s investigation?
A one-sample z-test for a population mean
A one-sample t-test for a population mean
A one-sample z-test for a population proportion
A two-sample t-test for a difference between means
A matched-pairs t-test for a mean difference
A report on a certain fast food restaurant states that, the mean order total, is $9. The manager of the restaurant
believes the mean is higher. A random sample of orders will be selected. The sample mean will be calculated and
used in a hypothesis test to investigate the belief. Which of the following is the correct set of hypotheses?
H0: x=9, Ha: x=9
H0: x=9, Ha: x>9
H0: μ=9, Ha: μ=9
H0: μ=9, Ha: μ>9
H0: μ=9, Ha: μ<9
Which two factors provide evidence to state that the sampling distribution of X-bar is approximately normal?
np≥10 and n(1−p)≥10
the population is stated as approximately normal
n is greater than or equal to 30
the population is stated as symmetric
2 sample t test for μₓ
paired t test for μₓ
What test would be appropriate if we wanted to show evidence for the difference in average ages at which teachers and plumbers retire?
Matched Pairs t-test
2-Sample t-test
A random sample of upperclassmen at your school is taken. What test would be appropriate if we wanted to show evidence to compare the average number of hours of sleep of juniors and seniors.
Matched Pairs T
2-Sample T
Livestock are given a special feed supplement to see if it will promote weight gain. Researchers report that the 77 cows randomly selected for the study gained an average of 56 pounds. It is known that the regular feed promotes a weight gain of 52 pounds with a population standard deviation is 5.3 pounds. What test would you use to determine if the weight gain using the new special feed supplement is significantly higher?
1 sample z test for means
1 sample t test for means
1 sample z test for proportions
1 sample t test for proportions
A study of road rage asked independent random samples of 596 men and 523 women about their behavior while driving. Based on their answers, each respondent was assigned a road rage score on a scale of 0 to 20. Are the conditions for performing a two-sample t test satisfied?
Yes; we have two independent random samples, large sample sizes and the 10% condition is met.
At a baseball game, 42 of 65 randomly selected people own an iPad. At a rock concert occurring at the same time across town, 34 of 52 randomly selected people own an iPad. A researcher wants to test the claim that the proportion of iPad owners at the two venues is different. A 90% confidence interval for the difference in population proportions(game − concert) is (−0.154, 0.138). Which of the following gives the correct outcome of the researcher’s test of the claim?
The manager of a sporting goods store offered a bonus commission to his salespeople when they sold more goods. A new manager dropped the bonus system. For a random sample of six sales, the weeks sales (in thousands of dollars) were 3.7 with the bonus (SD of 0.15) and 3.3 without the bonus (SD of 0.21). What test would you use to determine if sales dropped when the bonus system was discontinued?
1 sample t-test
2 sample t-test
1 proportion z-test
2 proportion z-test
A box of Raspberry Crunch cereal contains a mean of 13 ounces with a known standard deviation of 0.5 ounces. The distribution of the contents of cereal boxes is approximately Normal. The cereal company is afraid the boxes being over filled. Suppose they get a random sample of 25 boxes, and find a mean of 13.2 and a standard deviation of 0.154. What test would determine if the boxes are being overfilled?
1 sample z-test
2 sample t-test
1 proportion z-test
1 sample t-test

Which of the following is the most appropriate interval for the manager to use for such an estimate?
A
B
C
D
E

A town council wants to estimate the proportion of residents who are in favor of a proposal to upgrade the computers in the town library. A random sample of 100 residents was selected, and 97 of those selected indicated that they were in favor of the proposal. Is it appropriate to assume that the sampling distribution of the sample proportion is approximately normal?
A
B
C
D
E
Suppose a researcher wants to use a confidence interval to estimate an unknown population proportion p. Which of the following is not a correct statement?
The endpoints of the interval can vary with each new sample.
The probability that p is in the interval is equal to the level of confidence for the interval.
Whether the interval captures p is not known with certainty.
The population proportion p is fixed, but the sample proportion p^ can vary from sample to sample.
The interval either does or does not capture p.
A hypothesis test was conducted to investigate whether the population proportion of students at a certain college who went to the movie theater last weekend is greater than 0.2. A random sample of 100 students at this college resulted in a test statistic of 2.25. Assuming all conditions for inference were met, which of the following is closest to the p-value of the test?
0.0061
0.0122
0.0244
0.9756
0.9878
Consider a 90 percent confidence interval constructed to estimate the difference between two population proportions. Which of the following is the best interpretation of what is meant by 90 percent confidence?
The probability that the true difference in population proportions falls within the bounds of the confidence interval is 0.90.
For repeated random sampling from the populations with samples of the same size, approximately 90% of the sample proportions will fall within the bounds of the confidence interval.
If the sampling process is repeated 10 times, 9 intervals will capture the true difference between the population proportions and 1 interval will not.
For repeated random sampling from the populations with samples of the same size, approximately 90% of the confidence intervals constructed will capture the true difference between the population proportions.
For repeated random sampling from the populations with samples of the same size, approximately 90% of the confidence intervals constructed will capture the sample difference between the population proportions.

In the United States, 36 percent of the people have a blood type that is A positive. From a random sample of 150 people from Norway, 66 had a blood type that was A positive. Consider a hypothesis test to investigate whether the proportion of people in Norway with a blood type of A positive is different from that in the United States. Which of the following is the standard deviation used to calculate the test statistic for the one-sample z-test?
A
B
C
D
E
In a hypothesis test for a single proportion, which of the following is assumed for the calculation of the p-value?
The alternative hypothesis is true.
The null hypothesis is true.
The distribution of the population is approximately normal.
The sample proportion is equal to the hypothesized proportion.
The sample size is 30 or more.
Zoie completes a report by asking 70 students across campus. She found that 48% of CIAA students do not wash their hands after using the bathroom. What is the population of her survey?
the bathroom
CIAA students
48% of students
Zoie completes a report by asking 70 students across campus. She found that 48% of CIAA students do not wash their hands after using the bathroom. What is the sample size?
48
100
70
CIAA students

There are 400 students at Polly's school. She surveyed a random sample of 80 students to find their favorite hobby. 19 said they like to read. 30 said they like to be with friends. 8 said they like to do crafts. 23 said they like to play sports. Polly infers that doing crafts is the least popular hobby at her school.
Refer to the data table. Polly surveys two more samples. Do the results from these samples support the inference made from the first sample?
Yes, the survey results support the inference that doing crafts is the least popular hobby at Polly's school.
No, the survey results does not support the inference that doing crafts is the least popular hobby at Polly's school.
There are 400 students at Polly's school. She surveyed a random sample of 80 students to find their favorite hobby. 19 said they like to read. 30 said they like to be with friends. 8 said they like to do crafts. 23 said they like to play sports. Polly infers that doing crafts is the least popular hobby at her school.
Yovani estimates that about 200 students in the school favor playing sports as a hobby. Do you agree?
Yes, I used a proportion to find the number of students in the school who likely to prefer to play sports. 23/80 = 200/400; 200 students
No, I used a proportion to find the number of students in the school who likely to prefer to play sports. 23/80 = 115/400; 115 students

The dot plots show how long it took students in Mr. Chauncey's two science classes to finish their science homework last night. Find the means to make an inference about the data.
The 1st period mean is 35. The 2nd period mean is 38.75. On average, it took students in the 1st period class slightly longer to finish their homework than it did the students in the 2nd period class.
The 1st period mean is 38.75. The 2nd period mean is 35. On average, it took students in the 1st period class slightly longer to finish their homework than it did the students in the 2nd period class.
The 1st period mean is 35. The 2nd period mean is 38.75. On average, it took students in the 2nd period class slightly longer to finish their homework than it did the students in the 1st period class.
The 1st period mean is 38.75. The 2nd period mean is 35. On average, it took students in the 2nd period class slightly longer to finish their homework than it did the students in the 1st period class.
Litzy collects data from a random sample of 7th graders. Out of 40 respondents, 7 attend afterschool programs. Of the 200 7th graders attending Litzy's school, how many would be expected to attend afterschool programs?
14 7th graders
28 7th graders
35 7th graders
42 7th graders
Trinity surveys students in her computer class about time spent on computers by students in her school. Fill in the blank to explain why this is not a representative sample. This is not a representative sample because students in computer class are _________ to use computers than other students.
less likely
equally likely
more likely

The dot plot shows a random sample of the number of fish caught and released by 30 participants during a two-day fishing tournament. Select the inference that can be made based on the data collected.
On average, most participants caught and released 5 or more fish.
More participants caught 6 fish than any other number.
The same participants who caught and released 1 fish the first day caught and released 1 fish on the second day.
On average, participants caught and released more fish on Day 2.
The captain of the basketball team wants to determine where the team should go for their end-of-season celebration. Which of the following is a representative sample? Select all that apply.
The students in her homeroom
Players whose names are randomly selected from a hat
The players in the starting lineup
All players over 5 feet tall
Every 5th player selected from an alphabetical roster of the team
Anthony opened a new store and wants to conduct a survey to determine the best store hours. Which is the best representative sample?
A group of randomly selected people who come to the store in one week.
A group of randomly selected people who visit his website on one night.
Every person he meets at his health club one night.
The first 20 people who walk into his store one day.
Studies have shown that their is a higher cancer rate of people who worked around asbestos than people who are not exposed to asbestos. Asbestos is now illegal to use in construction. What inference can we make from this.
Asbestos does not cause cancer
Exposure to asbestos may increase your risk of cancer
There probably is no connection
Cannot make a determination
Data has determined that the probability of getting a ticket is greater if you drive a red car. Would it be fair to generalize that driving a red vehicle of any type would increase your chances of getting a ticket?
Yes because there is a direct correlation
No there may be a lurking variable.
If you are able to determine a direct correlation between two variables but can identify one or more confounding variables, can you make an inference between the two correlated variables?
Yes
No
Sometimes
There are two male high school students. One is considerably taller than the other. What could you generalize?
The taller student plays basketball
The shorter student does not eat well
The taller student is older
Nothing
If no p-hat value is given, what should you assume p-hat equals?
0.01
0.05
0.10
0.5
Ha: p > 0.8
Ha: p < 0.8
Ha: p = 0.8
Ha: p ≠ 0.8

