
 Worksheets
10.5 Phase Change Diagrams Questions
Total questions: 10
Worksheet time: 3hrs 30mins
What does a phase change diagram display?
Temperatures and phase changes of a material
The speed of a moving object
The density of different materials
The color changes of a substance
Which of the following best describes a phase change diagram?
A graph displaying temperatures and phase changes of a material
A chart showing the atomic number of elements
A table listing chemical reactions
A diagram of electrical circuits
At what type of temperature do phase changes occur?
At a constant temperature
At increasing temperature
At decreasing temperature
At random temperatures
Which state of matter exists at the lowest temperatures?
Solids
Liquids
Gases
Plasmas

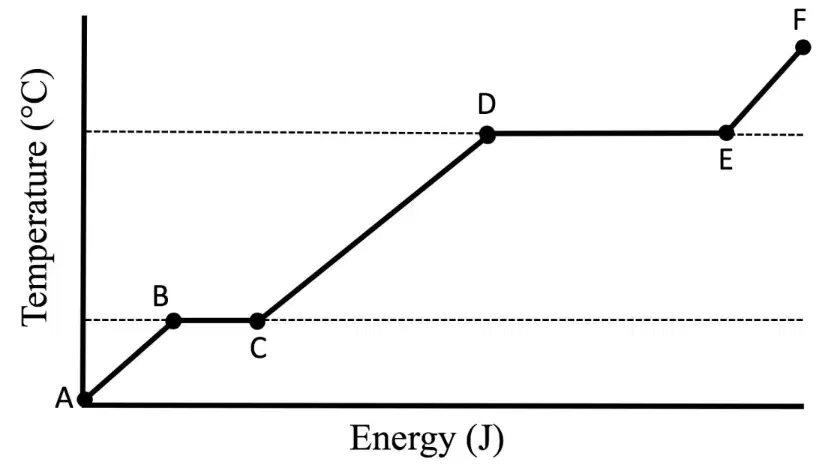
During which interval does a gas form?
B to C
C to D
D to E
E to F
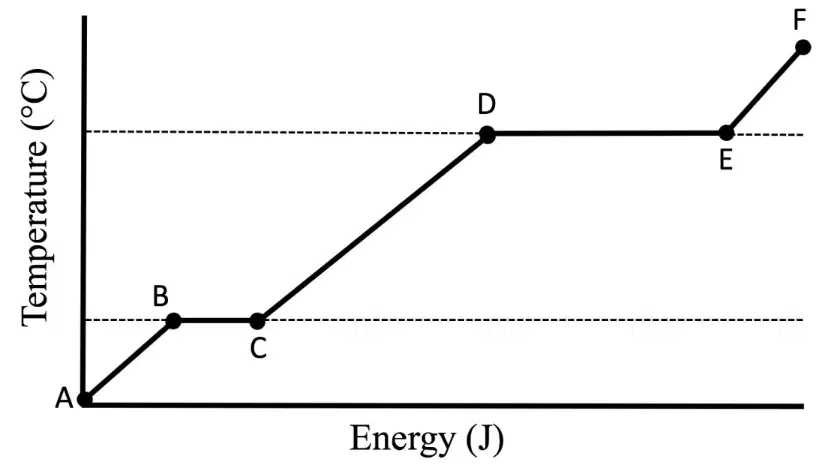
During which interval does a liquid form?
B to C
C to D
D to E
E to F
During which interval does a solid form?
A to B
C to B
C to D
E to D

How much heat transfer is required to melt the substance?
100 kJ
50 kJ
200 kJ
250 kJ

According to the heating curve shown, how much energy (in kJ) is required for the phase change from gas to liquid (condensation) for the substance?
100 kJ
150 kJ
200 kJ
250 kJ
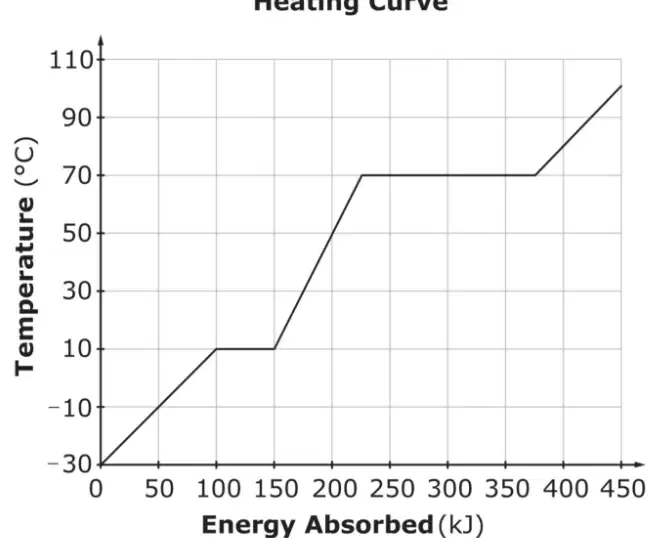
According to the heating curve, where do phase changes occur?
Where the temperature is changing.
Where the temperature is staying the same (flat lines).
It depends on the heating curve.
Where the lines are sloped and going up.

