
 Worksheets
TDM-Quiz-1
Total questions: 30
Worksheet time: 1hrs 18mins
Given that a zone has 275 households with access to car and 275 households without access to car and the average trip generation rates for each group are 5.0 and 2.5 trips per day, respectively. Assuming that in the future, households will have similar distribution with access and without access to a car, as per the existing situation. If there will be an addition of 55 households with similar distribution of car ownership, estimate future trips from that zone.
4125 trips per day
5275 trips per day
3750 trips per day
2745 trips per day
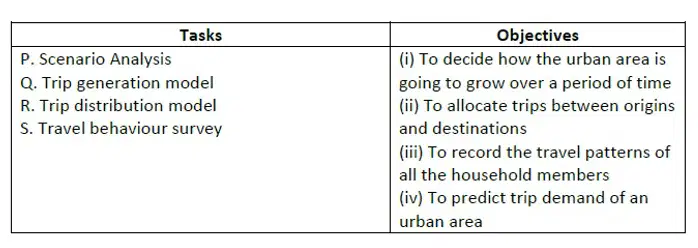
Match the following tasks as a part of traffic demand prediction with their respective objectives.
P-(i);Q-(iv);R-(iii);S-(ii)
P-(i);Q-(iv);R-(ii);S-(iii)
P-(iii);Q-(ii);R-(i);S-(iv)
P-(iv);Q-(iii);R-(i);s-(ii)
The total trips produced by small, medium and large household size categories in a zone are 400, 650, and 900 respectively. Out of the total trips produced by the small household size group, 60% are work trips,15% are recreational trips and 25% are other trips. Of the total trips produced by the medium household size category, 50% are work trips, 20% are recreational trips, and 30% are other trips. Out of the total trips produced by large household size group, 45% are work trips, 25% are recreational trips and 30% are other trips. The total number of recreational trips produced in the zone is ________.
340
515
415
440
The total trips produced by small, medium and large household size categories in a zone are 400, 650, and 900 respectively. Out of the total trips produced by the small household size group, 60% are work trips,15% are recreational trips and 25% are other trips. Of the total trips produced by the medium household size category, 50% are work trips, 20% are recreational trips, and 30% are other trips. Out of the total trips produced by large household size group, 45% are work trips, 25% are recreational trips and 30% are other trips, the total number of work trips and other trips produced in the zone with respect to small household size category is ________.
415
515
440
340
Trip distribution is a process_______
where measures of urban activity are translated into numbers of trips
which shows the travel flow between each pair of zones
where decisions are analyzed regarding mode of travel
by which the planner predicts the paths the trips will take
Which of the following are the synthetic models used for trip distribution?
Gravity Models
Opportunity Model
Growth Factor Model
All of the above
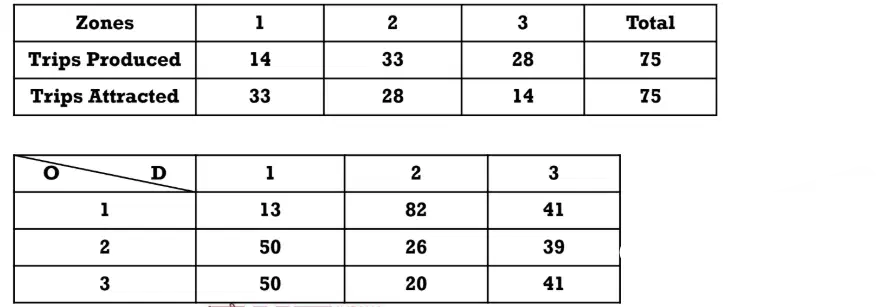
The number of work trips produced in and attracted to zones 1, 2 and 3 by public transit is given below. Friction factor (Fij)values obtained as a result of calibration are also given below in a matrix. Distribute the trips between zones by taking the zone-to-adjustment factor (Kij) as unity. Find the ratio of total trips attracted to the observed trip for zone 1 using the gravity model.
0.84
0.89
1.12
2.15
Which of the following is not the factor affecting trip generation?
Income
Car ownership
Family size
Built-up area of house
Which of the following assumptions in linear regression models tend to be violated in the case of zonal trip generation models
Homoscedasticity
Heteroscedasticity
Normal Distribution of Error Terms
Homogeneous Covariance
The category analysis for trip generation considers ____________________ as the fundamental analysis unit.
Zones
Industries
Person
Relative attractiveness as a factor is incorporated in which of the following growth factor methods?
Furness method
Detroit method
Average growth factor method
Fratar method
In intervening opportunity model the probability is determined by _____________________.
The size of destination
The order in which destination is encountered as trips proceed from the origin.
Both A & B
None of the above
What are the two main categories of trip distribution methods mentioned in the reference text?
Growth Factor and Synthetic Model
Gravity Model and Tanner Model
Uniform Factor Method and Average Factor Method
Fratar Method and Furness method
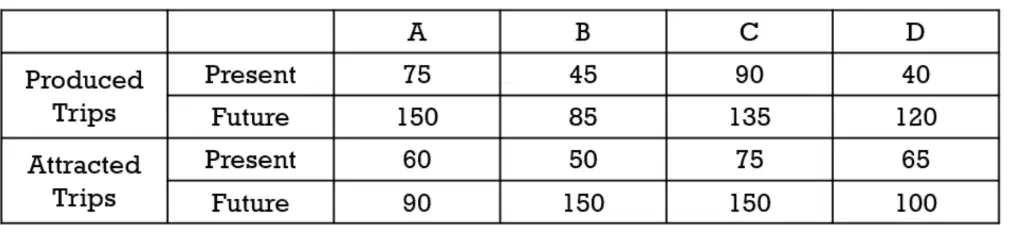
Calculate the area growth factor
1
1.96
0.51
1.69
What are the assumptions underlying the growth factor methods for trip distribution?
Uniform growth rates for the entire study area and limited present-day development
Varied growth factors for different trip types and diverse travel patterns
Specific growth rates for each zone and intensive present day development
Average growth factors between zones and equal growth rates for all zones
Select the basic assumption of the intervening opportunities model
The opportunity model is directly proportional to the number of intervening opportunities
The opportunity model is inversely proportional to the number of intervening opportunities
The number of trip interchanges is inversely proportional tothe number ofopportunitiesat the destination zone
All of the above
A person travelled from his home to office in the morning. He went to a canteen nearby for lunch and returned to office after lunch. In the evening, he went to his friend’s home and stayed there tonight. Which of the following statements is true based on the above given information?
All the trips are non-home-based trips
Two of the total trips are home-based
Two of the total trips are home-based
Two of the total trips are home-based
A person travelled from his home to office in the morning. He went to a canteen nearby for lunch and returned to office after lunch. In the evening, he went to his friend’s home and stayed there tonight. The total number of trip ends produced at the canteen is (a) .
A person travelled from his home to office in the morning. He went to a canteen nearby for lunch and returned to office after lunch. In the evening, he went to his friend’s home and stayed there tonight. The total number of trip ends is (a)
Accept or Reject the statement: Household size may be used as a variable for developing person trip attraction model
Accept
Reject
Which one is NOT a component in the TAZ & Network system?
Centroid
Link
Link Connector
Centroid Connector
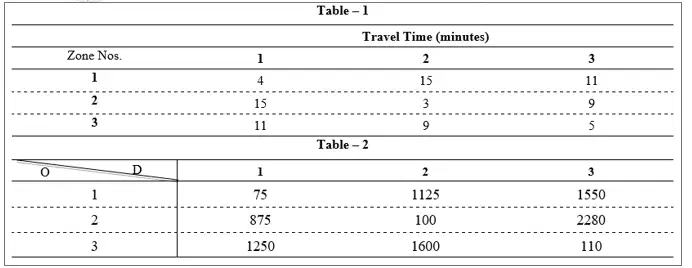
A region has three large municipal corporations which can be assumed as traffic analysis zones (TAZ). Data presented in Table 1 are the travel times between any two TAZs, which were collected using sensors. Assume the travel time impedance function takes the form 1/d^β, where ‘d’ is the travel time between any two TAZs. The initial value of β may be assumed as 2. Table 2 gives the base year O-D matrix collected through household surveys. As a transportation engineer, you are asked to carry out trip distribution using a doubly constrained gravity model. For the base year trip length frequency distribution, determine the percentage of trips between the time interval of 5.1 to 10 minutes using the above values
30%
43%
54%
29%
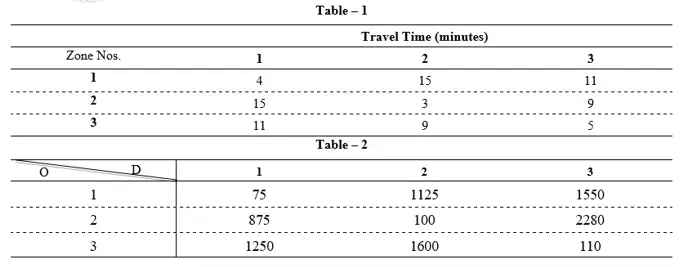
A region has three large municipal corporations which can be assumed as traffic analysis zones (TAZ). Data presented in Table 1 are the travel times between any two TAZs, which were collected using sensors. Assume the travel time impedance function takes the form 1/d^β, where ‘d’ is the travel time between any two TAZs. The initial value of β may be assumed as 2. Table 2 gives the base year O-D matrix collected through household surveys. As a transportation engineer, you are asked to carry out trip distribution using a doubly constrained gravity model. find out the value of production balancing factor (R1) calculated for the first zone?
0.926
0.961
1.159
1
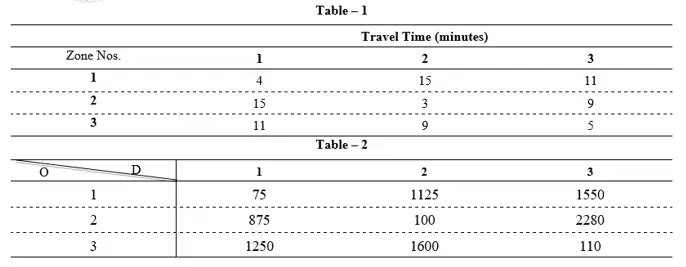
A region has three large municipal corporations which can be assumed as traffic analysis zones (TAZ). Data presented in Table 1 are the travel times between any two TAZs, which were collected using sensors. Assume the travel time impedance function takes the form 1/d^β, where ‘d’ is the travel time between any two TAZs. The initial value of β may be assumed as 2. Table 2 gives the base year O-D matrix collected through household surveys. As a transportation engineer, you are asked to carry out trip distribution using a doubly constrained gravity model. find out the value of production balancing factor (R2) calculated for the second zone?
0.926
0.961
1.159
1
A region has three large municipal corporations which can be assumed as traffic analysis zones (TAZ). Data presented in Table 1 are the travel times between any two TAZs, which were collected using sensors. Assume the travel time impedance function takes the form 1/d^β, where ‘d’ is the travel time between any two TAZs. The initial value of β may be assumed as 2. Table 2 gives the base year O-D matrix collected through household surveys. As a transportation engineer, you are asked to carry out trip distribution using a doubly constrained gravity model. find out the value of attraction balancing factor (C1) calculated for the first zone?
1
0.002244
0.00552
0.00474
In a transportation study, the average trip length for a specific zone is found to be 8.5 kilometers. If the average speed of vehicles in that zone is 50 km/h, calculate the average travel time for trips originating from that zone.
20.5 minutes
15.5 minutes
12.5 minutes
10.2 minutes
Given a traffic analysis zone with a population of 1,000 people, if the average trip generation rate is 3 trips per person per day, estimate the total number of trips generated by that zone in a day.
1,500 trips
2,000 trips
3,000 trips
4,000 trips
In a study of trip distribution, the total number of trips produced in zone A is 600, while zone B attracts 750 trips. If the gravity model is applied, what is the expected number of trips distributed from zone A to zone B if the friction factor is 0.8?
600 trips
500 trips
480 trips
700 trips
What is the primary purpose of the gravity model in trip distribution analysis?
To determine the average trip length
To analyze the impact of transportation policies
To predict the flow of trips between different zones
To estimate the total number of trips generated
Which of the following methods is commonly used to validate trip distribution models?
Cross-validation with historical data
Expert judgment assessment
Random sampling of trip data
Comparative analysis with other models

