
 Worksheets
Mitchell - World Geography Unit 1 Test
Total questions: 49
Worksheet time: 27mins
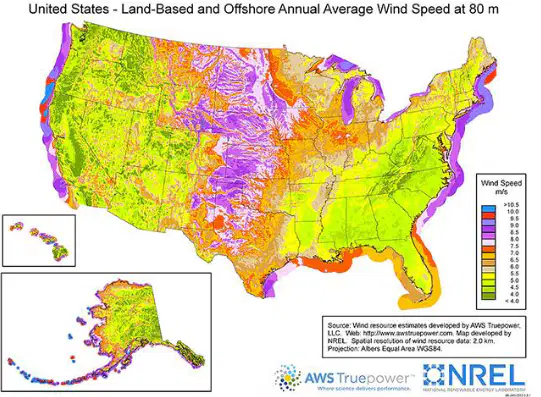
Select the statements which best explain the significance of using this type of source.
It is used as a way to make predictions of how cultural boundaries impact the environment.
It is used as a tool that helps geographers better understand the environments of a region.
It is used as a tool that reports data in a given region over a period of time.
It is used as a way to make predictions of how the environment could change.
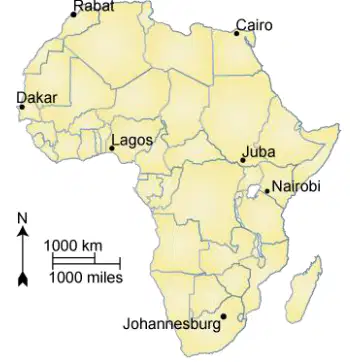
What part of a map would be the most useful to measure the approximate distance between the cities Nairobi and Johannesburg?
scale bar
scale ratio
compass rose
key or legend
Read the list.
• Fieldwork • Satellite images • Photographs • Maps • Globes • Databases • Primary sources • Diagrams
The best heading for this list is —
Varieties of Topographic Projections
Sources for Obtaining Geographical Information
Concepts of Absolute Location
Visual Representations of Geographical Information
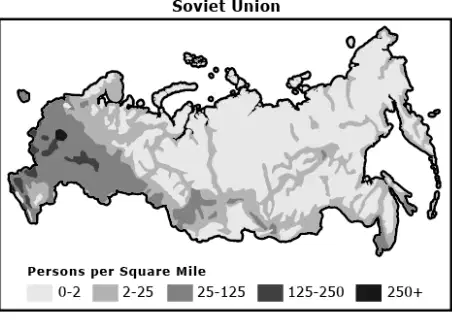
This map primarily focuses on —
population
physical features
resources
standard of living
A historical object that provides clues about people from the past
Religion
Ceremony
Calendar
Artifact
Geographic information is best acquired from all of the following EXCEPT—
maps
novels
pictures
satellite images
Which source can be used to get an accurate depiction of what a major city looks like from space?
satellite image
globe
map
photograph
Which geographic tool would best be used to compare how a region's population has changed over time?
Globe
Map
Satellite image
Statistical tables
All of the following can be done with Geographic Information Systems EXCEPT —
mapping regional crime rates
mapping population density
mapping constellations
mapping physical features
To get an accurate depiction of Earth, it would be best to use a —
globe
diagram
photograph
map
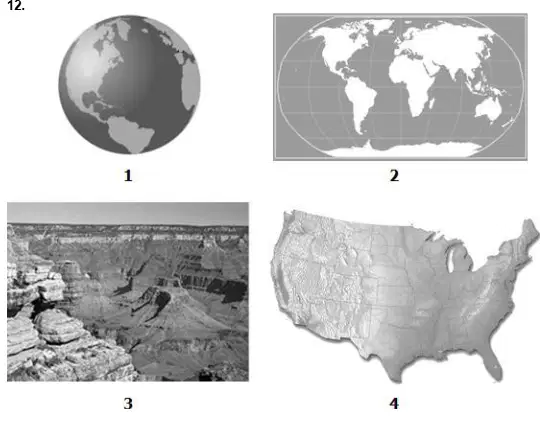
Which image would most likely be used to display elevation of a large area?
Globe
World map
Canyon photo
Relief map of the United States
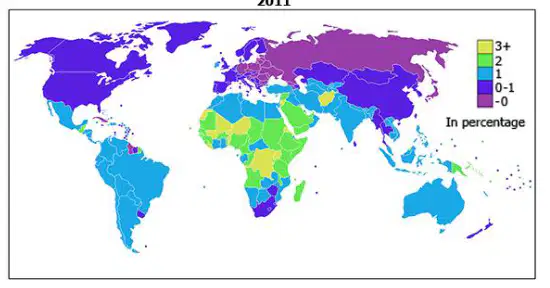
Based on the map, which continents have a majority of their countries with at least a 1% population growth rate?
South America
Africa
North America
Europe
Australia
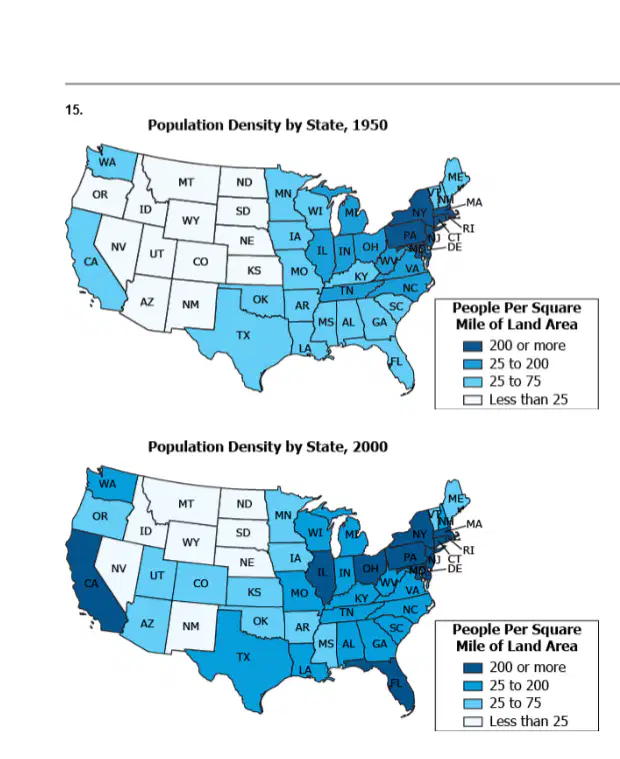
The two given maps show the population density of each state for the years 1950 and 2000. Which statement most accurately compares the change in population density over the years?
The increase in population density of California (CA) is more than Texas (TX).
The increase in population density of South Carolina (SC) is more than Florida (FL).
The increase in population density of Nevada (NV) is less than Utah (UT).
The increase in population density of Ohio (OH) is less than Illinois (IL).
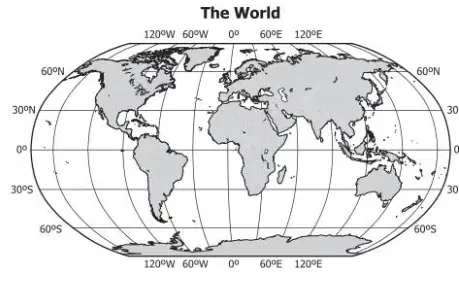
30°N, 120°E is located within the continent of —
North America
Asia
Europe
Australia
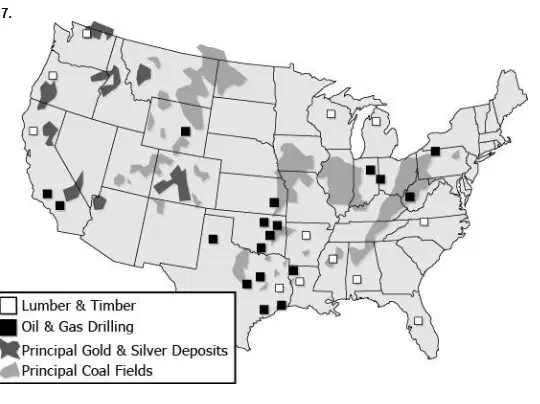
According to the map, which state most likely has the largest number of oil reserves?
West Virginia
Texas
California
Florida
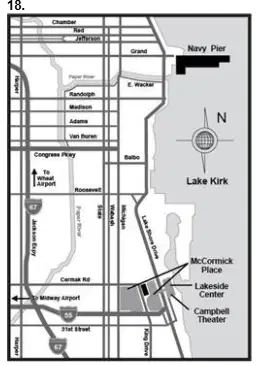
What is the main purpose for the image above?
Determine the climate of a region
Find directions to a specific location
Research the best agricultural methods of a location
Evaluate the level of education in a region
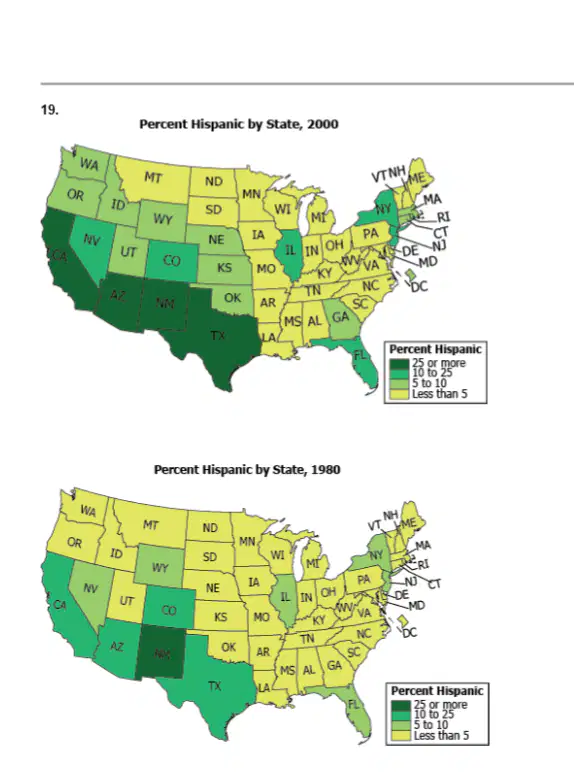
A student observed the two maps that show the percentage of Hispanic populations twenty years apart. Which of the following inferences can be correctly made from the maps?
The only state which has not experienced a change is New Mexico (NM)
More western states have experienced a change than the states in other regions.
The spread of Hispanic populations has decreased as the number of states seeing a decline in percentage are far more than the ones seeing an increase.
The change in the Hispanic population in Utah (UT) is less than Wyoming (WY).
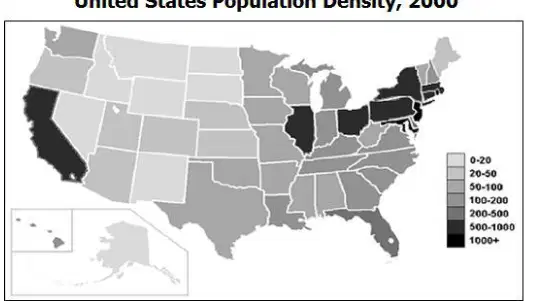
Which statement best supports the map?
The population density of states with a large land area have the highest population density.
The climate in the Pacific region of the United States is more suitable for large populations.
The population density of the Northeastern United States is higher than the rest of the United States.
The population density of the Southeastern United States is lower than the Midwestern United States.
The geographic source most likely used for viewing an area of the Earth from above is a —
Satellite image
Street map
Geographic Information System
Photograph
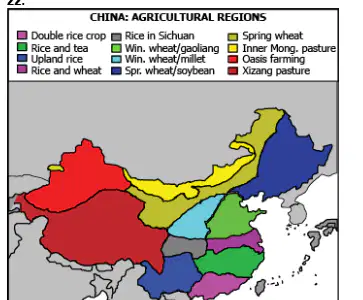
The maps shown illustrate different regions of China determined using different characteristics. Based on the maps of China shown, which statements are true?
Spring wheat is grown in southern China because it has a humid, continental type of climate.
In northwest China, oasis farming is practiced because it has a semiarid or a steppe climate.
Double rice cropping is done in the southwest China because it has a highland type of climate.
Winter wheat and millet cropping is practiced in southwest China because it has a subarctic type of climate.
Which map displays the different dialects contained in a country?
Vegetation
Political
Physical Map
Language
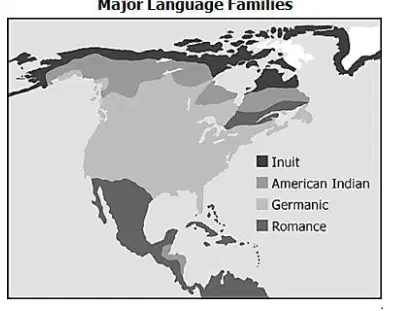
Which language family dominates the northern most areas of North America?
Inuit
American Indian
Germanic
Romance
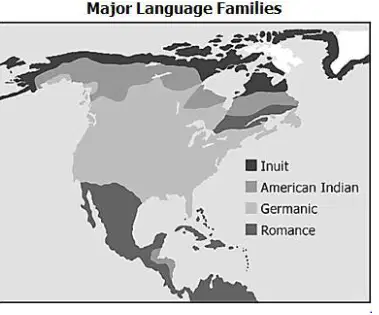
Which language family dominates the United States?
Romance
American Indian
Inuit
Germanic

Based on the map, which region of the world has the highest concentration of earthquake prone regions?
Australia
North America
Africa
South America
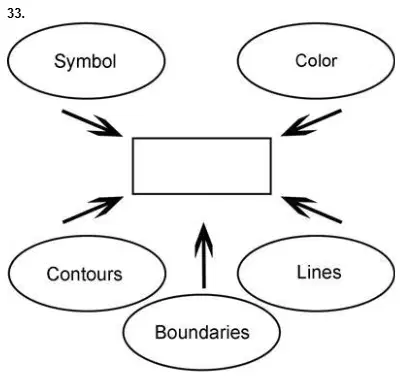
What does this graphic illustrate?
The way a map shows information
How people create mental maps
How cartographers illustrate political maps
The way latitude and longitude work
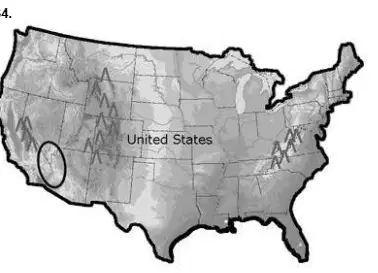
Which type of map is displayed in this illustration?
Precipitation
Climate
Physical
Vegetative
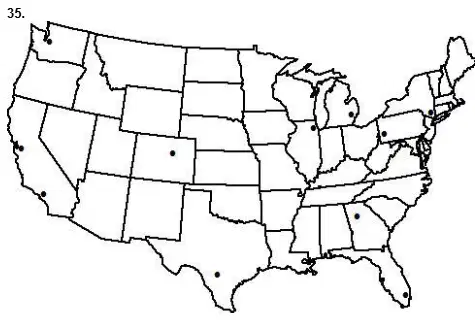
This map can be used to identify all of the following EXCEPT —
A. major rivers
B. state locations
C. major cities
D. state boundaries
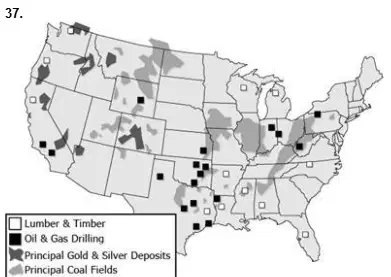
The main purpose of this map is to identify —
the location of physical features
major ethnic groups
major vegetation regions
the location of major resources
Which type of map displays rivers, oceans, mountains, and other landforms?
Political
Physical
Economic activity
Vegetation
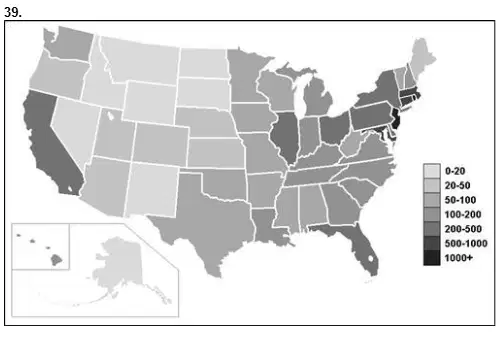
The main purpose of this map is most likely to determine the —
population density of the United States
climate of a region in the United States
major ethnic groups in the United States
economic activity of the United States
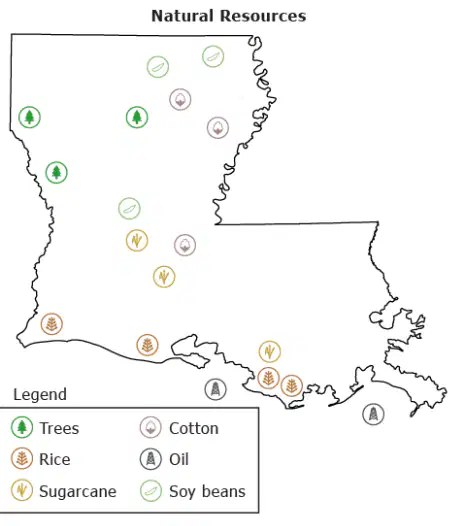
Which natural resource is important along the coast of Louisiana?
Tobacco
Cotton
Trees
Rice
Lines of Longitude are measured ___________ and ___________ from the Prime Meridian.
North, West
North, South
East, West
East, South
Click on the physical map


What is the center line of longitude?
Equator
Prime meridian
Longitude
latitude

What does the map key show you on this map?
physical features
political boundaries
land use and resources
population density
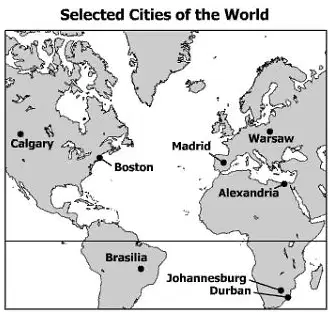
Which two cities have opposite seasons?
Boston and Madrid
Warsaw and Alexandria
Calgary and Durban
Johannesburg and Brasilia
"Jimmy knows the route from his house to his school, and can name each street along the way."
This statement is an example of-
absolute location
a primary source
a thematic map
mental mapping
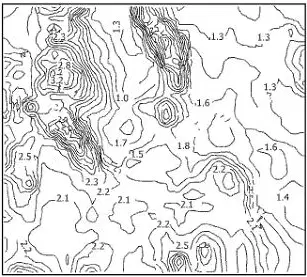
This type of map is used to show-
elevation
population
natural resources
political boundaries
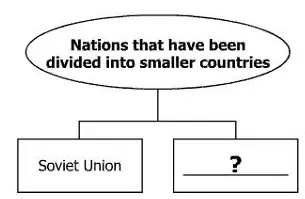
Which country best completes this diagram?
Mexico
Yugoslavia
Portugal
Chile
Which name do Western societies commonly use for the Arabian Gulf?
Gulf of Aden
Red Sea
Sea of Marmara
Persian Gulf

This peninsula has been divided as the result of
religious differences
a political dispute
a language barrier
physical characteristics
During the time of Christopher Columbus, which continent would have been most accurately mapped?
Europe
Asia
South America
North America
Pakistan was created to address the conflict between which two religious groups
Buddhists & Muslims
Christians & Hindus
Buddhists & Christians
Muslims & Hindus

The darker-shaded region is a
colonial province
neutral country
disputed territory
demilitarized zone
The Sea of Japan and the East Sea reflect what difference on maps?
Population
Perspective
Government
Absolute Location
Why did the Europe map have a major change
World War III
World War II
World War Z
Spanish-American War

People and the environment interact
– they affect each other -
Human Environment Interaction
Place
Location
Region
The 5 themes of geography are:
Location, __________, Region, Movement and Human/Environ. Interaction.
Population
Sub-Region
Place
Scale

Which maps show the boundaries of states and countries?
Political
Population Density
Physical
Resource

