
 Worksheets
Artifacts
Total questions: 118
Worksheet time: 2hrs 57mins
Produced by tissue motion (noise)
Low frequency Doppler-shifts can be corrected using the Wall Filter (rejection).
(a)
“Mirror Image”.
Spectral Doppler above and below the baseline.
(a)
Flow “appears to be bidirectional”.
(a)
Doppler gain too high.
Insonation angle near 90 degrees and flow at the beam focus.
(a)
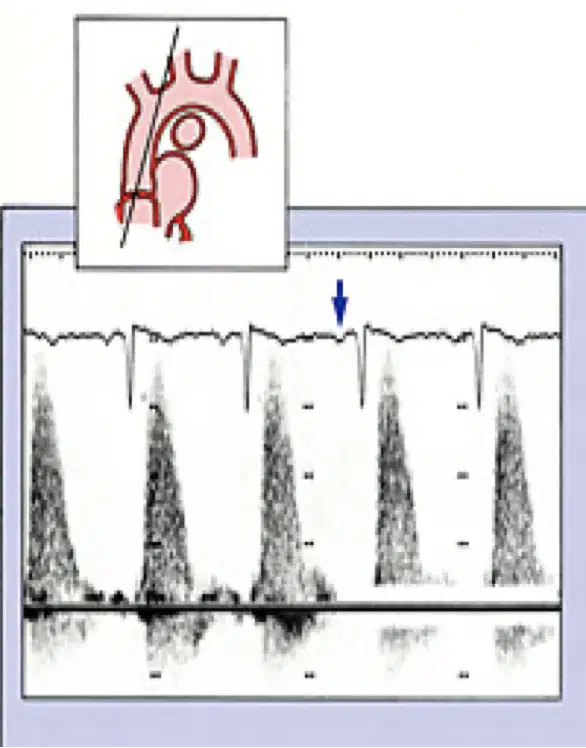
This image shows
(a)
A (a) eliminates low frequency Doppler signals near the spectral baseline.
- Displays all the Doppler-shift frequencies detected from targets moving at different velocities.
(a)
Identifies individual velocities
(a)
Used with Pulsed Doppler and Continuous Doppler.
Accurate.
Display all components.
(a)
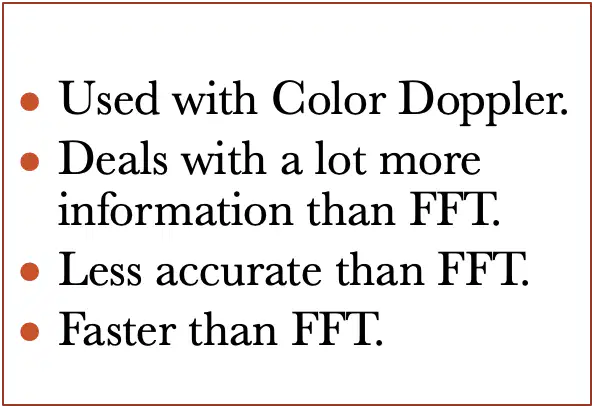
(a)

(a)
(a) consists of a wide range of velocities, includes reversed flow components, and is readily appreciated as multiple colors on color Doppler images.
Fill-in of the window associated with turbulence
(a)
Turbulent flow pattern is visible as (a) with components below the baseline
(a) flow is considered normal near vessel bifurcations (eg, the carotid bulb) but elsewhere is suggestive of abnormality .
Quantitative
Doppler-derived measurement.
(a)
Reflects the vascular resistance of a vessel
(a)
The (a) can be calculated from spectral measurements by using the equation
RI = (PSV − EDV)/PSV
Where PSV is the peak systolic velocity and EDV is the end-diastolic velocity
(a)
The (a) can be calculated by using the equation
PI = (PSV − EDV)/MV
Where MV is the mean flow velocity during the cardiac cycle.
(a)
The RI and the PI provide information about
__ and __ that cannot be obtained from measurements of absolute velocity alone.
(a)
What is an Artifact?
Artifacts are incorrect representations of anatomy or motion caused by some problematic aspect of the imaging technique.
Artifacts are accurate and intentional representations of anatomy or motion created to enhance medical images
Artifacts are useful features in medical imaging that provide additional diagnostic information about the patient's condition.
“Artifacts are naturally occurring structures in the body that imaging techniques are designed to highlight
Representations that are:
- NOT REAL.
- MISSING or NOT SHOWN.
- INCORRECTLY POSITIONED.
- ASSIGNED INCORRECT BRIGHTNESS
(a)
Why do artifacts occur?
The intensity and location of echoes in ultrasound are determined randomly and do not depend on any set rules
“Ultrasound display equipment does not rely on any physical assumptions and simply shows real-time images based on echo recordings
Ultrasound display equipment relies on physical assumptions to assign the location and intensity of each received echo.
Ultrasound images are generated purely from visual observation and do not involve echo signals or physics
(a) can cause artifacts when assumed conditions are not true
Sound travels at 1540 m/s
Sound travels in a straight line
All sound attenuation exactly
0.5 dB/cm/MHz
(a)
The echoes detected originated from within the main ultrasound beam
(a)
An echo returns to the transducer after a single reflection
(a)
The depth of an object is directly related to the amount of time for an ultrasound pulse to return to the transducer as an echo
(a)
The speed of sound in human tissue is constant,
The sound beam and its echo travel in a straight path, and
The acoustic energy in an ultrasound field is uniformly attenuated.
(a)
(a)
(a)
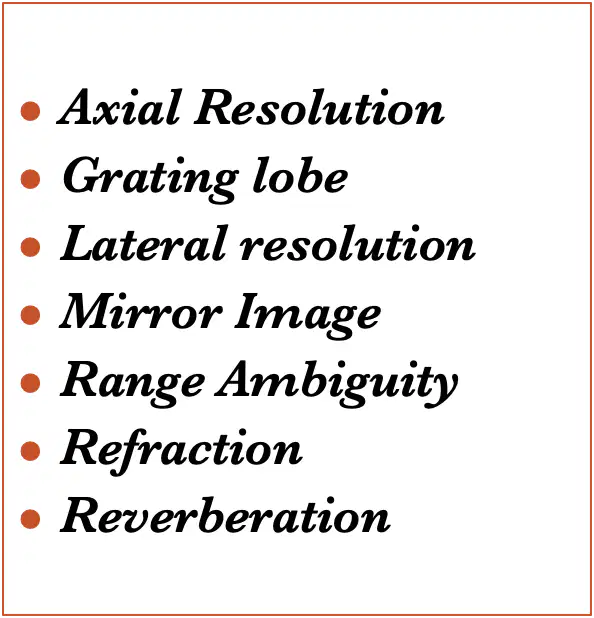
Axial resolution
grating lobe
Lateral resolution
Mirror image
(a)
Range ambiguity
Refraction
Reverberation
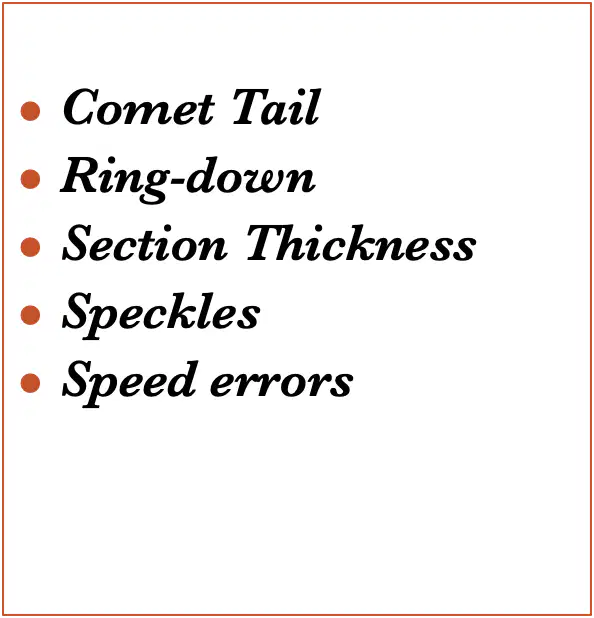
Comet tail
(a)
Ring down
Section thickness
Speckles
Speed errors
(a)
Enhancement
Focal Enhancement
Refraction Edge Shadowing
Shadowing
(a)
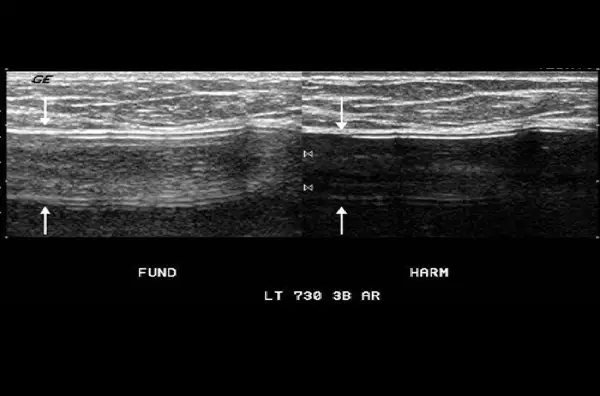
This image shows
(a)
This image shows
(a)
Multiple
Equally spaced echoes
Caused by bouncing of echoes between two strong reflectors
(a)
Echoes placed beneath the real reflector
Parallel to main axis
(a)
Diagram shows ultrasound echoes being repeatedly reflected .
(a)
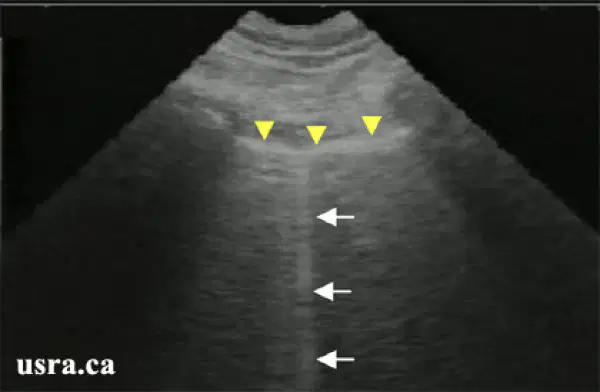
This image shows
(a)
This image shows
(a)
Form of reverberation
Closed spaced, discrete echoes
(a)
Hyperechoic line downward
Strong reflectors (surgical clips for example)
(a)
Assumption that sound travels directly to a reflector and back is invalid
(a)
Most likely to occur in mediums with high propagation speed
(a)

This is image shows
(a)
Similar to Comet Tail; but,
Closed spaced, discrete echoes cannot be separated
(a)
Ring down - Hyperechoic line
downward created by (a)
(Gas bubbles)
Parallel to sound beam’s main axis.
(a)
Single, long hyperechoic echo
(a)
The reverberations are spaced very narrowly and blend into a small band
(a)
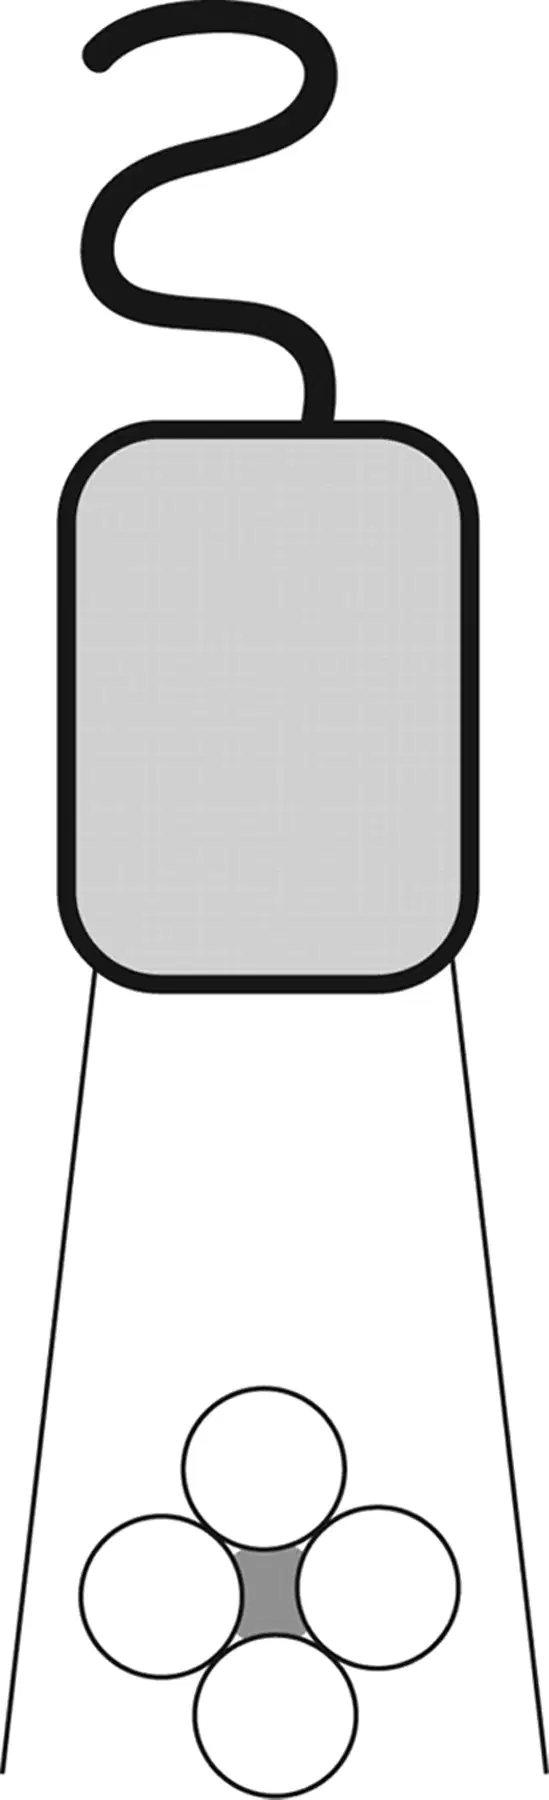
Diagram shows the main ultrasound beam encountering a ring of bubbles with fluid trapped centrally
(a)
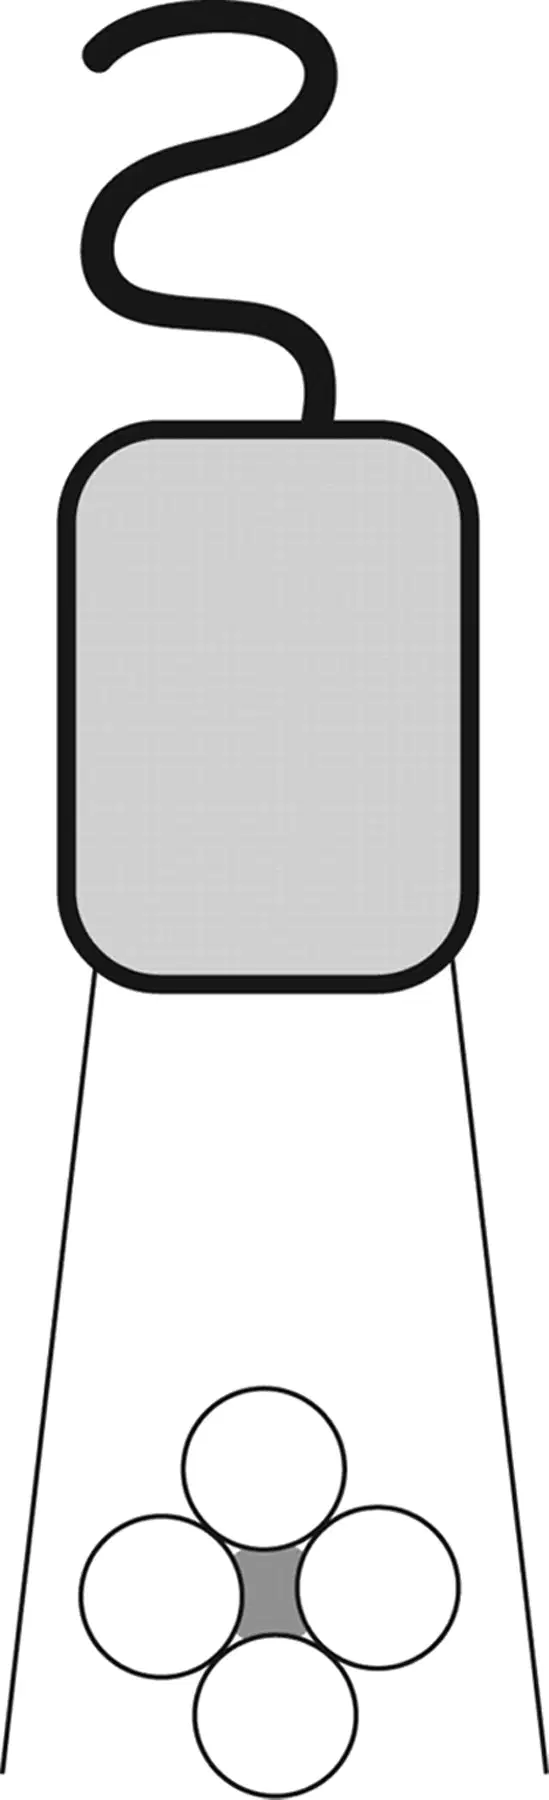
Vibrations from the pocket of fluid cause a continuous source of sound energy that is transmitted back to the transducer for detection
(a)

The display shows a bright reflector with an echogenic line extending posteriorly
(a)
a form of reverberation.
(a)
Shows structures that are on one side of a strong reflector as being present on the other side as well.
(a)
Mirror image appears (a) than a real structure
The strong reflector lies on straight-line between transducer and artifact
(a)
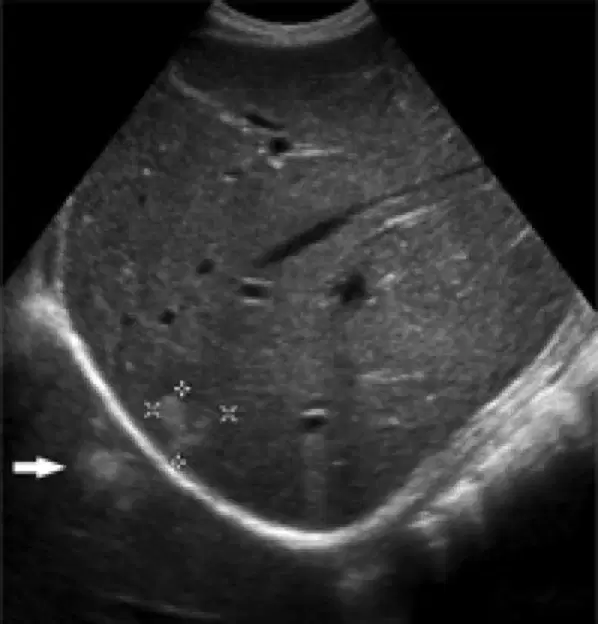
This image shows
(a)
Sounds travels in a straight line, and sound travels directly to a reflector and back to the transducer.
(a)
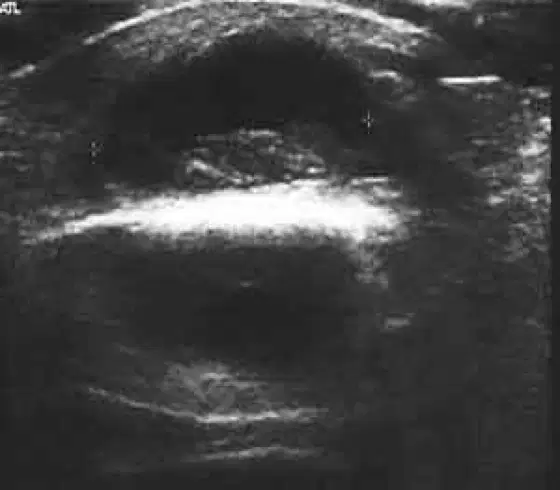
This shows
(a)
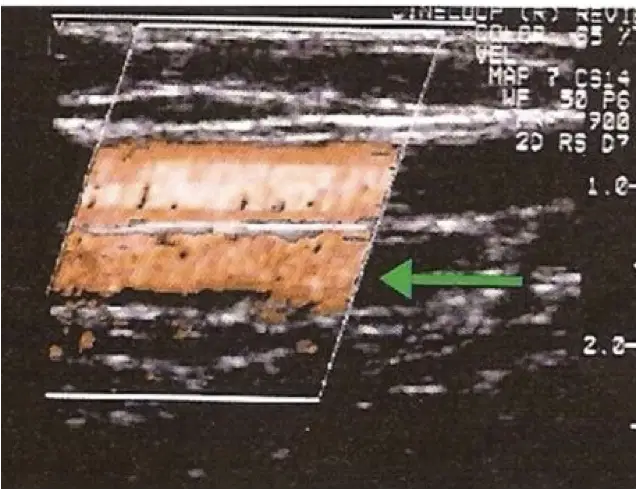
This shows
(a)
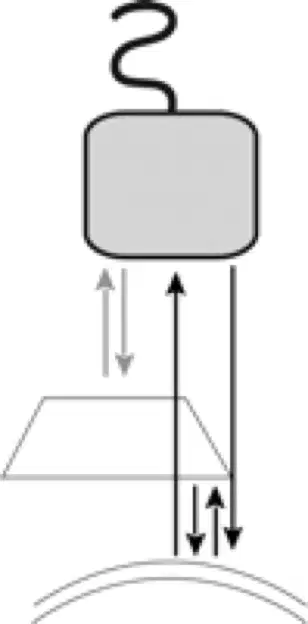
This diagram displays
(a)
are beams propagating from a single element in different directions from the primary beam.
(a)
are additional beams emitted from an array transducer.
Stronger than side lobes
(a)
Side and Grating Lobes are (a) than the primary beam; unless, they hit a strong reflector (gas, bone).
Lobe artifacts (a) lateral resolution

This image shows
(a)
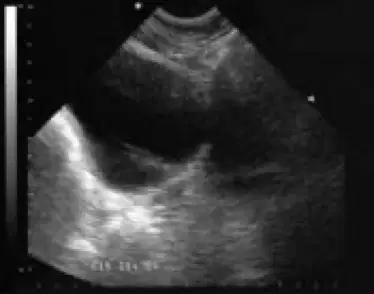
This image shows
(a)
The display assumes that the echoes returning from this
off-axis object came from the main beam
and misplaces and duplicates the structure.
(a)
displaces reflectors laterally from their original locations
(a)
A change in velocity of the ultrasound beam as it travels through two adjacent tissues with different density and elastic properties may produce a refraction artifact
(a)
In refraction, (a) perpendicular incident ultrasound energy encounters an interface between two materials with different speeds of sound
When this occurs, the incident ultrasound beam changes direction
(a)
The degree of this change in direction is dependent on both the angle of the incident ultrasound beam and the difference in velocity between the two media.
(a)
This relationship is described by Snell’s law
(a)

This shows
(a)
Diagram shows the refraction or change in direction of the obliquely angled incident ultrasound beam as it travels between two adjacent tissues with different sound propagation velocities (C1 and C2).
(a)
The incident ultrasound beam with (a) encounters two structures.
The object in the path of the refracted portion of the beam
is misplaced because the processor assumes a (a)
path of the beam
artifacts affect the lateral resolution
(a)
Two images side by side of the same reflector
(a)
Can cause the reflector to be positioned incorrectly.
(a)
When the assumed speed of sound (1.54 mm/µs) is incorrect. Therefore, the 13µs/cm rule is incorrect
(a)
When the medium has a (a) speed of sound (returning echoes will arrive sooner); then, the calculated distance to the reflector will be smaller
and the reflector will be displayed too close to the transducer
When the medium has a higher speed of sound (returning echoes will arrive sooner); then, the calculated distance to the reflector will be (a)
and the reflector will be displayed too close to the transducer
When the medium has a higher speed of sound (returning echoes will arrive sooner); then, the calculated distance to the reflector will be smaller
and the reflector will be displayed (a) close to the transducer
When the medium has a higher speed of sound (returning echoes will arrive sooner); then, the calculated distance to the reflector will be smaller
and the reflector will be displayed too close to the transducer
(a)
When the speed of sound is less than 1.54 mm/µs, the reflector will be located far away from the transducer
(a)
Sounds travels at a speed of exactly 1,540 m/sec
(a)
Artifactual images from above or below the assumed plane of scanning.
(a)
Related to the thickness of the beam (perpendicular to the scanning plane)
(a)
Slice thickness artifacts fill-in anechoic structures
(a)
Texture seen on image may not correspond to tissue texture
(a)
Results from interference effects between multiple reflectors received simultaneously which can add together.
(a)

This image shows
(a)

Imaging plane is extremely thin
(a)
Beam wider than separation between two reflectors positioned side by side.
(a)
Two reflectors show as only one.
Least likely at the focus of the beam
(a)
When two reflector are close together in the main axis of the beam and the pulse is long.
(a)
Axial resolution: Only (a) reflection will show.
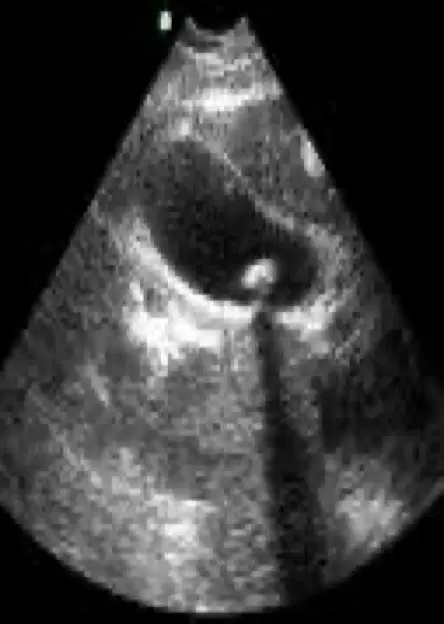
This shows
(a)
When the ultrasound beam encounters a focal material that attenuates the sound to a greater or lesser extent than in the surrounding tissue
(a)
the strength of the beam distal to this structure will be either weaker or stronger than in the surrounding field
(a)
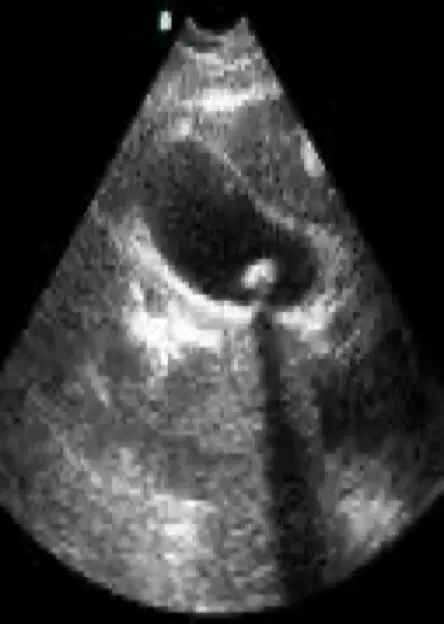
Assumption that the intensity of a reflection is related to the tissue creating the reflection, is (a)
Hypoechoic region arising from the border of a curve structure.
(a)
Beam diverges with lower intensity causing the shadow
(a)
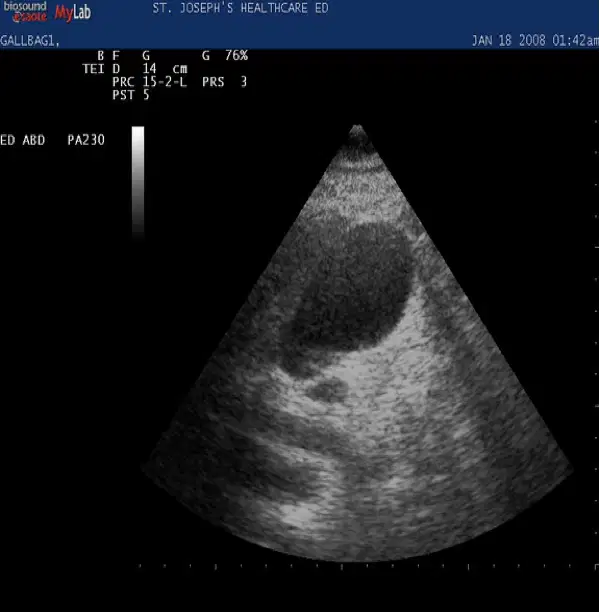
Shadow “by refraction”.
(a)
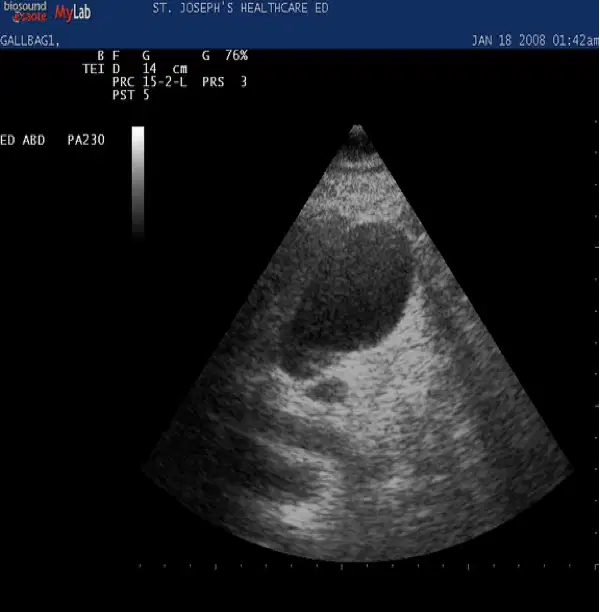
This shows
(a)
Hypo or anechoic; after hitting a curved reflector. Downwards and parallel to beam
(a)
When the ultrasound beam encounters a focal weakly attenuating structure within the imaging field, the amplitude of the beam beyond this structure is greater
(a)
amplitude of the beam beyond this structure is greater than the beam amplitude at the same depth in the rest of the field
(a)
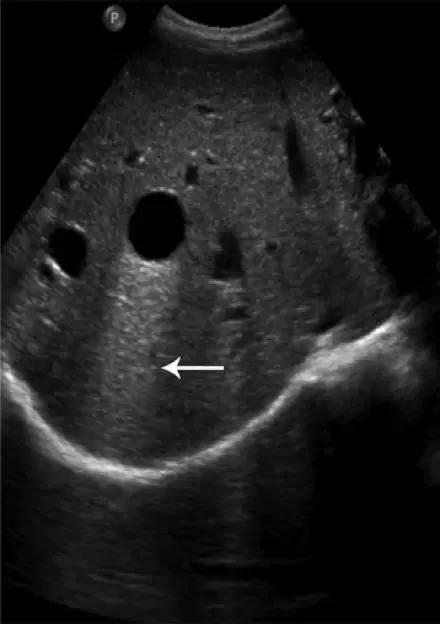
This showsE
(a)
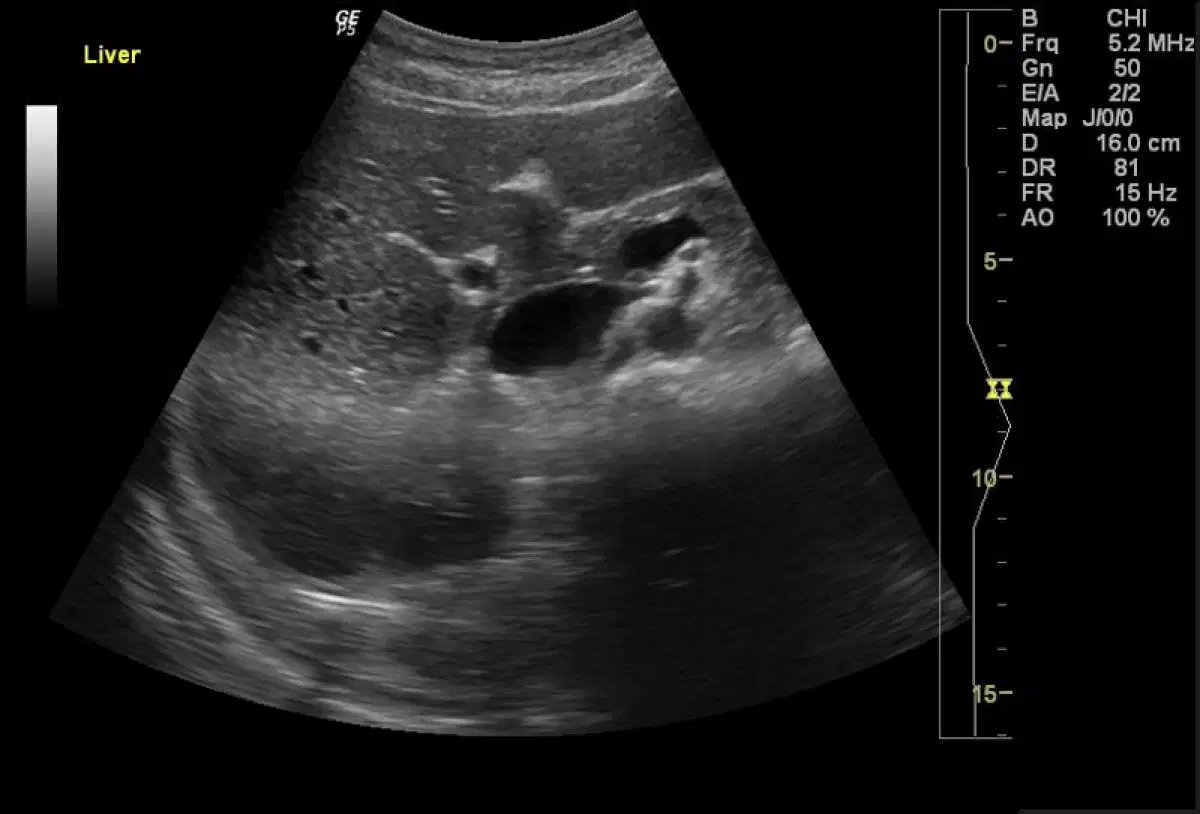
This shows
(a)
SIDE-TO-SIDE REGION BRIGHTER THAN TISSUES AT OTHER DEPTHS
(a)

