
 Worksheets
AP HUG!!!
Total questions: 81
Worksheet time: 3585secs
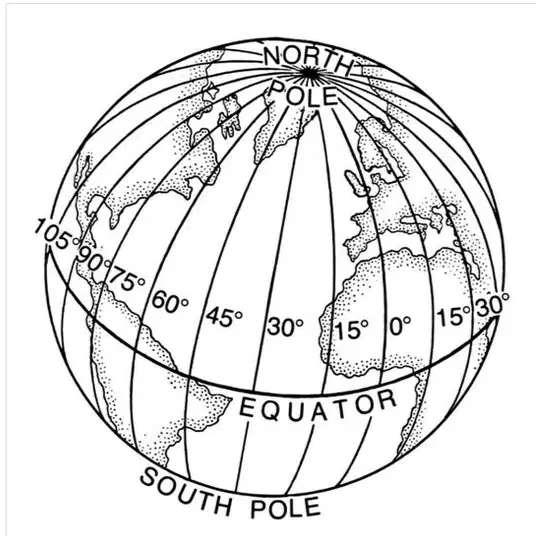
the numbering system used to indicate the location of meridians drawn on a globe & measuring distance east & west of the prime meridian
Equator
Prime Meridan
Longitude
Latitude
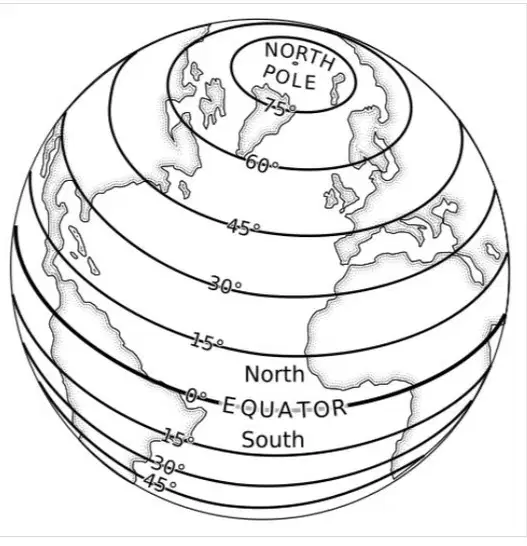
the numbering system to indicate the location of a parallel
Latitude
longitude
Equator
Prime meridian

the meridian that passes through the Royal Observatory at Greenwich, England (0 degrees longitude)
prime meridian
meridian
Equator
Longitude
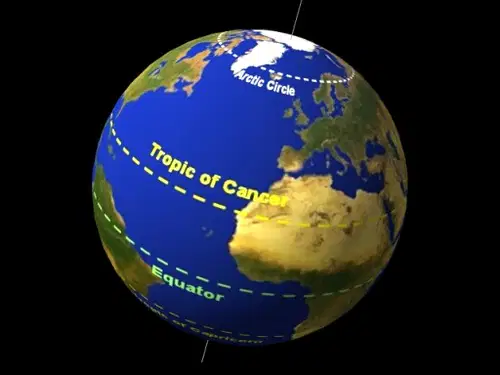
23.5 degrees latitude N
Tropic of Cancer
Tropic of Capricorn
Tropic of Aries
Tropic of Scorpio
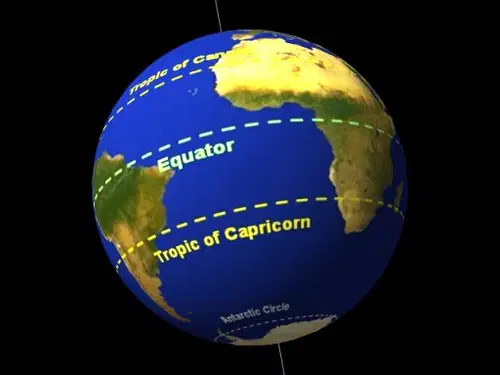
23.5 degrees latitude S
Tropic of Capricorn
Tropic of Cancer
Tropic of Aries
Tropic scorpio
expansion diffusion
spread the feature from one place to another in an additive process (idea or innovation spreads outward from the hearth)
this is when something spreads through the population and/or an area so that the total number of people or size increase
spread of an idea through physical movement of a GROUP ppl from one place to another
rapid, widespread diffusion of a characteristic throughout the population (picks up on the trend and idea around the same time)
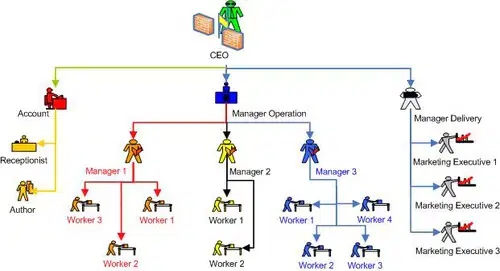
hierarchical diffusion
spread of an idea from persons or nodes of authority or power to other persons or places (cities to cities, small pop. to bigger pop.)
This occurs when ideas pass from an important person,city or community to (less important one)
spread the feature from one place to another in an additive process (idea or innovation spreads outward from the hearth)
spread of an underlying principle even though a characteristic itself apparently fails to diffuse; create change to original (ex. Apple phones)
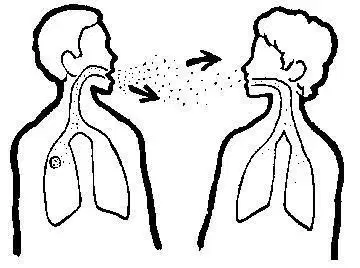
contagious diffusion
spread the feature from one place to another in an additive process (idea or innovation spreads outward from the hearth)
spread of an idea from persons or nodes of authority or power to other persons or places (cities to cities, small pop. to bigger pop.)
rapid, widespread diffusion of a characteristic throughout the population (picks up on the trend and idea around the same time)
The spread of an idea throughout space without regard to it hierarchy usually (person to person)

stimulus diffusion
spread of an underlying principle even though a characteristic itself apparently fails to diffuse; create change to original (ex. Apple phones)
A specific trait is rejected, but the underlying or principles are spread
rapid, widespread diffusion of a characteristic throughout the population (picks up on the trend and idea around the same time)
spread of an idea from persons or nodes of authority or power to other persons or places (cities to cities, small pop. to bigger pop.)
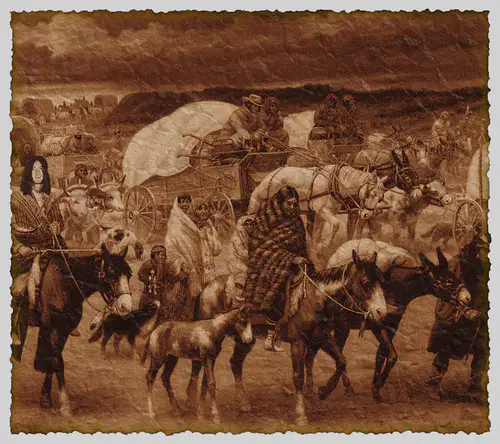
relocation diffusion
spread of an underlying principle even though a characteristic itself apparently fails to diffuse; create change to original (ex. Apple phones)
spread the feature from one place to another in an additive process (idea or innovation spreads outward from the hearth)
spread of an idea through physical movement of a GROUP ppl from one place to another
This is when an individual or group migrates from one place to another bring their ideas and traits with them

What projection is shown below?
Mercator
Robinson
Goode's
Buckminster-Fuller
conical
Another way to refer to a functional region is
nodal
formal
uniform
areal
focused
The science/art of map making is known as
Geography
Cartography
Topology
Topography
Human ecology
An area distinguished by one or more unique characteristics is abione
ecosystem
uniform unit
region
landscape
The study of how humans and the environment interact is called
natural science
cultural diffusion
environmental determinism
cultural ecology
The concept that physical environment sets limits on human actions, but people have the ability to adjust to the physical environment is called
special association
possibilism
climate
environmental determinism
cultural relativism
Moving toward the border of the United States, English becomes less common and Spanish is more often spoken. What type of region does this gradual change of language reflect?
Formal
vernacular
function
bilingual
Which of the following is not a type of distortion on a map?
area
shape
elevation
direction
proximity
The extent, or spread, of something over an area is
distribution
concentration
density
pattern
scale
which type of map would best show population density
choropleth
isoline
proportional symbol
dot distribution

What is the map scale?
Global
Regional
National
Sub-National
Local
What is the scale of analysis?
Global
Regional
National
Sub-National
Local
What type of map is this?
Cartogram
Choropleth
Dot
Graduated Symbol
Reference

What is the map scale?
Global
Regional
National
Sub-national
Local
What type of map is this?
Cartogram
Choropleth
Dot
Graduated Symbol
Reference

What is the scale of analysis?
Global
Regional
National
Sub-national
Local
What is the map scale?
Global
Regional
National
Sub-national
Local
What type of map is this?
Cartogram
Choropleth
Dot
Graduated Symbol
Isoline

What is the scale of analysis?
Global
Regional
National
Sub-national
Local
What is the map scale?
Global
Regional
National
Sub-national
Local
What type of map is this?
Cartogram
Choropleth
Dot
Graduated Symbol
Isoline

What is the map scale?
Global
Regional
National
Sub-national
Local
What type of map is this?
Cartogram
Choropleth
Dot
Graduated Symbol
Reference


Which of the following best describes the spatial pattern of adult literacy rates presented in the map?
It provides an economic perspective on the productivity of each country’s workforce.
It provides an economic perspective on earnings for each country’s population.
It provides a political perspective on each country’s level of civic participation.
It provides a political perspective on each country’s system of government.
It provides a perspective on each country’s level of social development.

The darkest shading on the map indicates the areas with the highest population densities. Which of the following statements best describes the pattern of population density shown?
Manhattan appears to have the lowest population density at all three scales.
New York City’s hinterlands have the highest population density.
Population densities appear to be uniform at all three scales
New York City and New York State have similar population densities.
Manhattan appears to have the highest population density at all three scales.

Which spatial patterns on the maps shown would be most helpful to someone selecting the location for a new coffee shop?
A
The map of New York State, because it shows the least and most densely populated counties in the state.
The map of New York City, because it shows which boroughs have the greatest number of people.
The map of the Borough of Manhattan, because it shows both population density and the pattern of streets.
D
The map of the state of New York, because it shows where the largest cities are located.
The map of the Borough of Manhattan, because it shows the shoreline of the island of Manhattan.

Which of the following geospatial technologies is typically used to analyze the data layers such as those shown in the maps?
Aerial photography interpretation
Satellite navigation systems
Remote sensing satellites
Geographic information systems (GIS)
Global positioning systems (GPS)

The maps show data most likely collected through
election results
census surveys
satellite imagery
informal observation
interviews
Which of the following statements best explains the concept of sustainability?
Natural resources are the domain of humans because of the ability of humans to take appropriate action for their use without fear of resource depletion.
Natural resources should be used until they become too scarce or too expensive because of the immediate need for human survival.
Natural resource use should be balanced with the needs of the environment and future generations because many resources are nonrenewable.
Natural resources will be replaced by technological goods because of concerns that all natural resources will become obsolete within the next generation.
Natural resource use should generate economic profits because of the new technologies that make procuring the resources cost effective.
In 1854, London physician Dr. John Snow mapped the spatial relationship between deaths from the waterborne disease cholera and the locations of water pumps which brought in water directly from tunnels connected to the River Thames. From Snow’s research it was determined that a public water pump had been contaminated by sewage.
What geographic principle explains the significance of Snow’s research?
As cities remove natural resources from the landscape, those resources become insignificant.
Even in areas of urban land use, there is a significant relationship between nature and society.
Once water enters an area of urban land use, that water is no longer considered a natural resource.
The prosperity of a society is determined by environmental factors, such as the availability of natural resources.
Societies leave a cultural imprint on the land, such as the pattern of streets and water systems.
For centuries, sugar crystals were made from the evaporated juice of sugarcane, a plant grown only in tropical and subtropical climates. In the 1800s, industrial methods were developed to manufacture crystalline sugar from sugar beets. This allowed for large amounts of sugar to be produced in colder, temperate climate zones.
Which of the following geographic concepts best explains the ability of humans to use technology to overcome the limitations of climate and modify the landscape?
Environmental determinism
Possibilism
Cultural relativism
Contagious diffusion
Political ecology

Which of the following concepts best explains the differences among the values shown in the table?
Spatial analysis
Scale of analysis
Map scale
Relative location
Relative direction

Which of the following patterns is evident on the map of population density?
The Appalachian Mountains are less densely populated than the Rocky Mountains
The Midwest is much more densely populated than the Southeast.
The Great Plains are less densely populated than the Midwest.
The Pacific Coast is far less populated than the Atlantic Coast of the United States
The Rocky Mountains are more densely populated than the Southwest

Which of the following statements is an accurate comparison of the two map projections shown?
The Mercator projection accurately shows direction but distorts the size of some areas compared to the Robinson projection.
The Robinson projection accurately shows direction but distorts the size of some areas compared to the Mercator projection.
The Mercator projection accurately shows distances but distorts direction compared to the Robinson projection.
The Robinson projection accurately shows shapes but distorts direction compared to the Mercator projection.
The Mercator projection accurately shows area but distorts shapes compared to the Robinson projection.

Which of the following map types is shown?
Isopleth
Choropleth
Dot density
Reference
Topographic

The data presented in the map shown depict
latitude in a Robinson projection
longitude in a Mercator projection
population in a cartogram
elevation topographic map
taxation in a flow-line map

Which of the following is a characteristic of the Mercator projection?
The size and shape of countries in the higher latitudes are greatly exaggerated
The size of all countries is accurate, but the shape is distorted
Countries near the Equator appear 50 percent larger than countries in the middle latitudes.
The projection is designed to maintain undistorted outlines of landmasses.
Distances on the Mercator projection are real and accurate.

Which of the following statements about the Robinson projection is correct?
It is more useful for long-distance navigation than the Mercator projection.
It is better for making topographical maps than the Mercator projection.
It is more accurate than the Mercator projection in showing the sizes of countries in higher latitudes.
It is more useful for showing the distribution of human populations than the Mercator projection.
It is better for estimating territorial waters in lower latitudes than the Mercator projection

The images show a topographic map and a geographic information systems (GIS) representation of Mount Shasta in California. Which of the following statements best explains why these printed images are geometrically distorted representations of Earth’s surface?
Some maps do not show the actual coloration of Earth’s surface and vegetation.
GIS can only display two-dimensional layers.
The planet’s gravitational poles are not located at the poles of Earth’s axis.
The three dimensions of Earth’s surface are displayed on a two-dimensional page.
Printed maps alter the sense of place that people can have about a location.

The satellite images show changes to a portion of the Louisiana coast between 1984 and 2017. The table shows the changes in land acreage. Which of the following best describes the changes and a consequence of the changes?
The expansion of coastal cities, which results in increased acreage of urban land cover
A decrease in the acreage of coastal land, which affects the prices of local property
An increase in the acreage of coastal land, which will be added to navigational charts for shipping
The rise of sea levels, which results in decreased land acreage available for homes and businesses
An increase in land acreage caused by the construction of polders for land reclamation

Which of the following spatial patterns accurately describes the data presented in the map?
Most continents have countries with secondary school enrollments below 75 percent
There are no countries in Africa with secondary school enrollments above 90 percent.
The majority of countries with less than 70 percent secondary school enrollment are in sub-Saharan Africa.
The secondary school enrollment is proportional to population density.
Landlocked countries have secondary school enrollments above 90 percent.
The pattern of human settlement - people spread across the earth is called:
Population density

A region that exists as an idea in someone's mind:
formal region
functional region
perceptual (vernacular) region

The scale of this map of the U.S. is:
local
national
regional
global

John Snowden's cholera map is a ______ map:
cartogram
choropleth
dot density
graduated symbol
topographic

According to the Thematic Map, which is a state where segregation was prohibited?
Wyoming
Florida
Oklahoma
Colorado
Functional Region
central area connected to others by transportation, communication, or economic activity
area that shares common human or physical characteristics
subjective image created by people's thoughts and feelings about an area
the predominance of Roman Catholicism

Which are TRUE statements about the use of maps in human and physical geography? CHOOSE AS MANY AS APPLY!
Every map projection distorts the surface of the Earth in some way.
Maps refelct the bias of the cartographer who created the map.
Maps are used as both tools of reference and tools of communication.
Maps have little value to geographers since they are not 100% accurate.
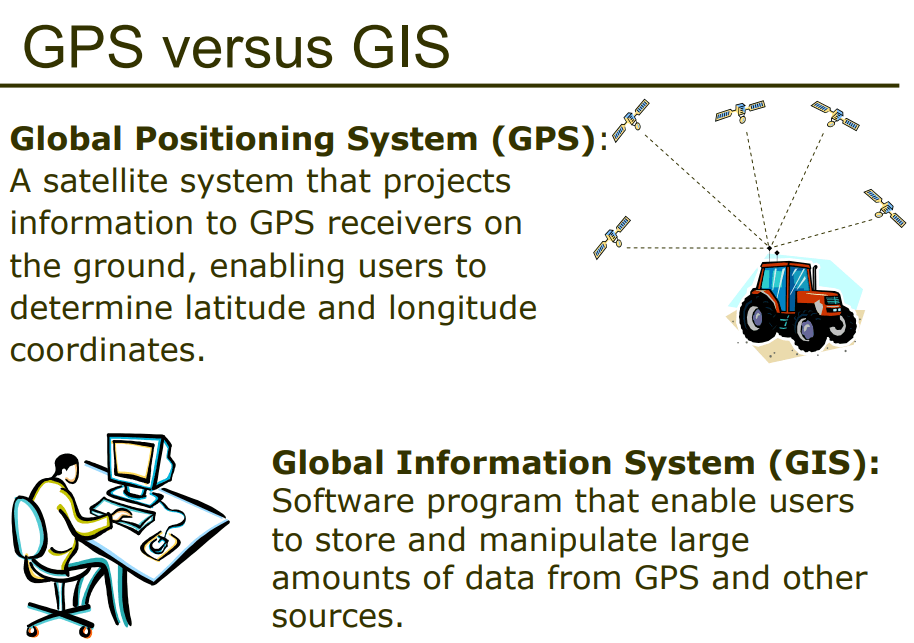
GPS and GIS are examples of contemporary mapping tools that rely on ______ technology.
remote sensing/satellite
computer
smart phone/satellite
International Space Station


Spatial coordinates of latitude and longitude express
relative location
absolute location
relative direction
absolute direction
relative distance

The Dutch use of polders to drain and use land THAT IS BELOW SEA LEVEL is a good example of
environmental determinism
possibilism
The notion that the physical environment causes social development – the environment limits human activity
environmental determinism
possibilism
culture
resources
According to possibilism
the physical environment is directly responsible for a group's development
the physical environment sets limits on humans that they can overcome by choices
human beings are responsible for caring for their physical environment
humans only live in places where life is possible
The name given to a location is referred to as a
site
situation
toponym
region

