
 Worksheets
Velocity & Distance Graphs
Total questions: 22
Worksheet time: 38mins

Use the graph above and pick the most accurate description of the object's motion
object is moving at constant speed
object is speeding up
object is at rest
object is slowing down

Use the picture above to choose the most accurate description of the object's motion
object is at rest
object is slowing down
object is moving at a constant speed
object is speeding up
What does a horizontal line on a velocity time graph indicate?
Deceleration
Acceleration
Constant speed
No movement
Match the graph to the description:
"The car is accelerating speeding up (positive acceleration)."
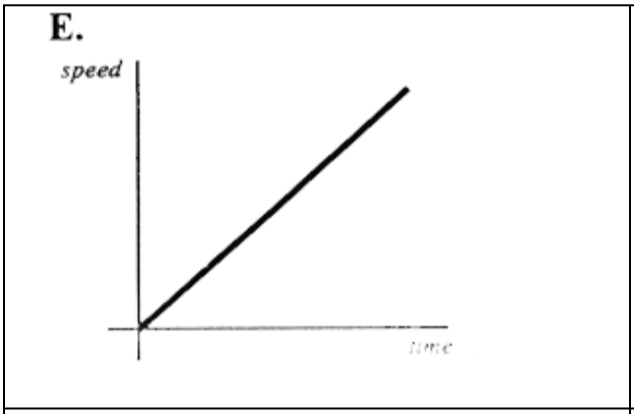
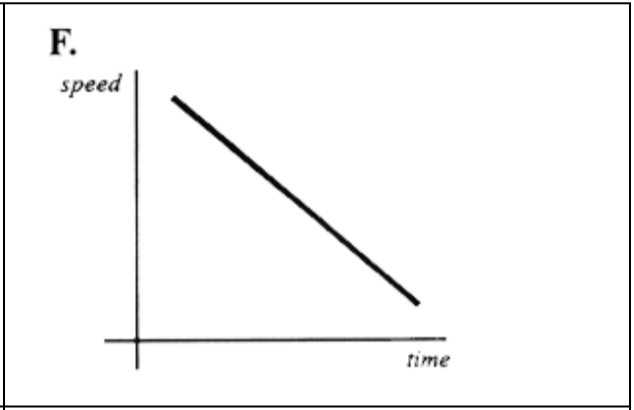
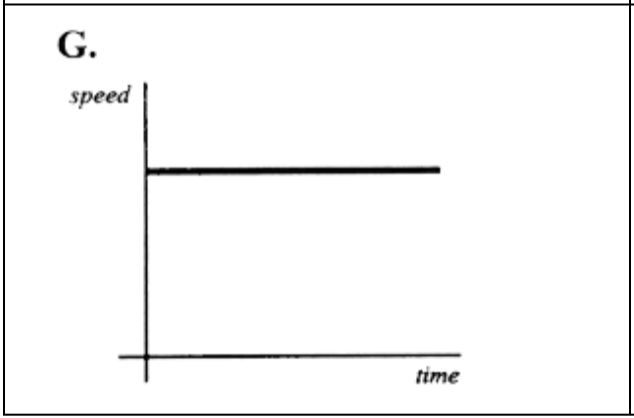
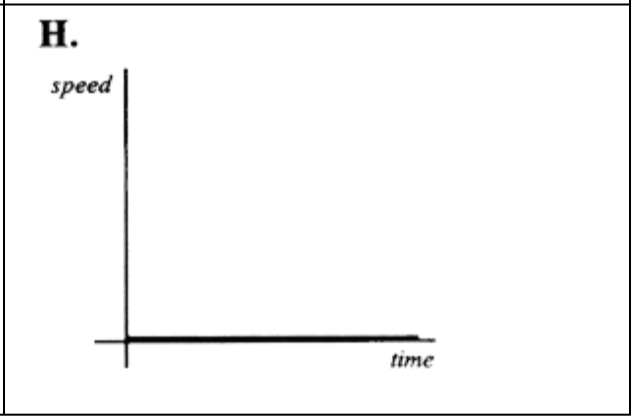

What is happening in this graph from point B to C? This is a SPEED-TIME GRAPH !! Look CAREFULLY !
(a)

What does the line on this graph represent?
Stationary
Constant negative acceleration
Acceleration
Constant speed (velocity)

Between which two points is the car parked?
AB
DE
FG
BC


Match the description to the graph:
"The car is stopped."


Match the description to the graph:
"The car is traveling at a constant speed."

Match the description to the graph:
"The car is coming back."

Segment A-B The bus is _________________.
at rest
returning (to original position)
moving forward
Match the description to the graph:
"The car is slowing down."

Describe the motion in the graph:
Constant Speed (positive slope)
Stopped (at rest)
Acceleration (increasing speed)
Return Home (negative slope)
A measurement of how fast an object is moving with direction
Velocity
Speed
Vector
Acceleration
The slope of a velocity - time graph represents?
Velocity
Displacement
Acceleration
Time
The y-axis of a velocity - time graph represents?
Velocity
Displacement
Acceleration
Time
The x-axis of a velocity - time graph represents?
Velocity
Displacement
Acceleration
Time

The graph depicts what type of motion?
Rest
Constant Velocity
Speeding up
Slowing down

