
 Worksheets
ToolingU - Intro to Six Sigma 171
Total questions: 30
Worksheet time: 15mins
How would you apply the DMAIC method in a Six Sigma process improvement project?
By defining, measuring, analyzing, improving, and controlling a process
By only measuring and analyzing data
By implementing solutions without analysis
By skipping the control phase
When analyzing data using Six Sigma, which tool would you use to visually compare the frequency of different categories?
Pie Charts
Frequency Distribution Charts
Run Charts
Root Cause Analysis
How can you use Pareto Charts in the context of Six Sigma data analysis?
To identify the most significant factors in a process
To display data over time
To show the root cause of a problem
To implement solutions directly
How do Six Sigma projects typically determine which processes to target?
By targeting any process that is easy to change
By focusing on processes that are critical to quality for the customer
By choosing the process that costs the least to improve
By selecting processes based on employee preference
What is the difference between external and internal customers in a Six Sigma context?
External customers are employees, internal customers are buyers
External customers are people who buy the product, internal customers are people within the company
External customers are suppliers, internal customers are managers
External customers are always more important than internal customers
A customer specifies that a certain number of defective parts are acceptable as long as the order arrives on time. In this case, what is considered CTQ?
The number of defective parts
The delivery time
The color of the product
The packaging material
Which of the following is NOT a method for identifying CTQ characteristics?
Conducting customer surveys
Tracking customer complaints
Collecting measurable data
Ignoring customer feedback

How does the role of a Master Black Belt (MBB) in Six Sigma differ from that of a Black Belt (BB)?
MBBs mentor lower-level team members and set project goals, while BBs lead initiatives and work full-time on projects.
MBBs only collect data, while BBs provide resources.
MBBs are responsible for process design, while BBs are temporary staff.
MBBs work part-time, while BBs work full-time on non-Six Sigma tasks.
If a team is using charts, graphs, and mathematical formulas to study collected data and find the root causes of problems, which DMAIC step are they performing?
Analyze
Control
Improve
Measure
At which stage of DMAIC does the team brainstorm, select, and implement solutions based on data analysis?
Define
Measure
Improve
Control
What is the main focus of the Control step in the DMAIC process?
Gathering data
Standardizing the process and tools to monitor the process
Mapping customer requirements
Brainstorming solutions
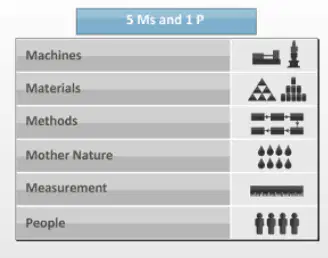
Which of the following best describes the purpose of identifying the 5 Ms and 1 P in a Six Sigma project?
To find the sources and causes of variation in a process
To increase the number of employees in a company
To reduce the cost of raw materials
To improve marketing strategies
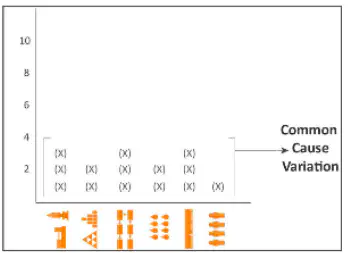
How does common cause variation differ from special cause variation in terms of identifying the source of the problem?
Common cause variation can be traced to a single source, while special cause variation cannot.
Common cause variation cannot be traced to any one cause consistently, while special cause variation can be traced to one cause consistently.
Both types of variation can always be traced to a single source.
Special cause variation is always expected and normal, while common cause variation is not.
When applying DMAIC in a Six Sigma project, what is being addressed?
The study of a problem’s source
The steps involved in a Six Sigma project
The types of variation in a process
The major sources of manufacturing errors
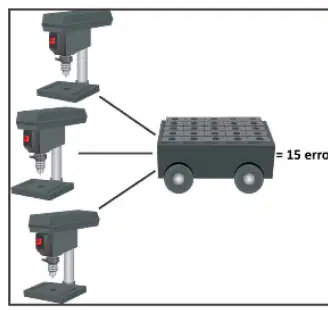
Why is it important to separate parts produced by different machines when analyzing defects in a Six Sigma process?
To make it easier to count the total number of parts produced
To determine which machine is causing special cause variation
To reduce the number of machines needed in production
To increase the number of defects found
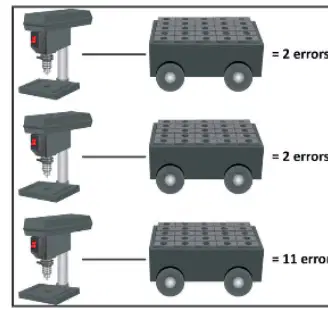
If two machines are making two errors per 100 parts and one machine is making 11 errors per 100 parts, what does this indicate in a Six Sigma analysis?
All machines are performing equally well
There is a special cause variation associated with one machine
The process is in control and no action is needed
The total number of errors is not important
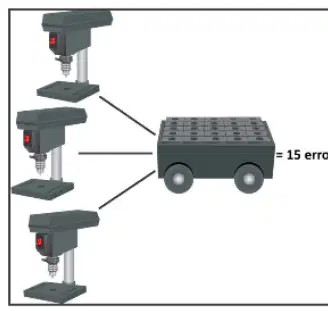
How does mixing parts from different machines in the same bin affect the ability to identify the source of defects?
It makes it easier to identify which machine caused the defects
It has no effect on identifying the source of defects
It makes it difficult to determine which machine is causing the errors
It reduces the total number of defects
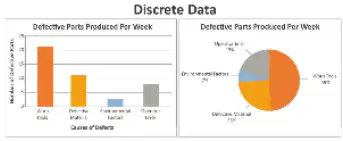
Why can't discrete data be mathematically manipulated in the same way as continuous data?
Because discrete data is always measured in time units
Because discrete data categories cannot be logically added or subtracted
Because discrete data is always a result of a process
Because discrete data is always compared with other data
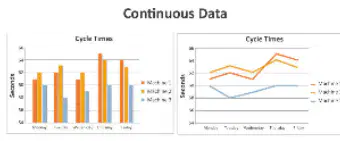
Which of the following is an example of continuous data?
The number of defective parts produced per week
The total number of errors in a process
Cycle time measured and compared across machines
The number of pass/fail inspection results
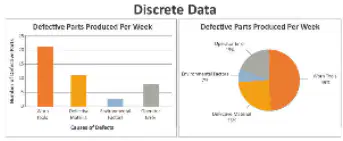
In a manufacturing process, what type of data would be used to record the total number of errors and categorize them into causes?
Continuous data
Variable data
Discrete data
Process data
How does continuous data provide more detailed information about a process compared to discrete data?
Continuous data is always collected faster.
Continuous data includes actual measurements, allowing for more precise comparisons.
Discrete data is less reliable than continuous data.
Continuous data is only used for defective parts.
Which tool would most likely be used to collect discrete data in a manufacturing process?
A thermometer
A go/no-go gage
A ruler
A stopwatch
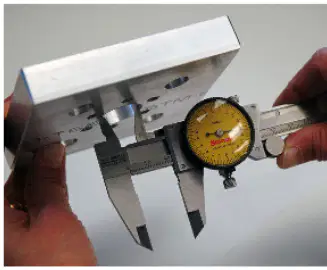
What type of data is being collected in this scenario, and why is it important in Six Sigma projects?
Discrete data, because it counts the number of parts.
Continuous data, because it involves taking specific measurements.
Discrete data, because it uses a go/no-go gage.
Continuous data, because it estimates the size of the part.
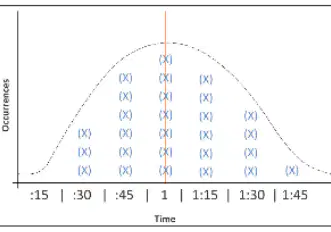
How can an operator use frequency distribution tools to analyze inspection times?
By recording inspection times as Xs in columns and analyzing the shape of the distribution
By only recording the fastest inspection time
By ignoring the distribution and focusing on average time only
By using random numbers instead of actual inspection times
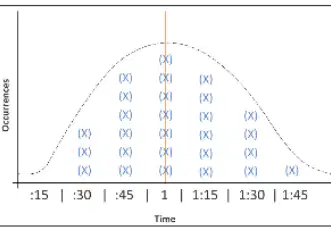
What is the purpose of the bar in the middle of the frequency distribution chart for inspection times?
To indicate the specification for inspections lasting one minute
To show the highest number of occurrences
To separate different types of inspections
To mark the end of the inspection period
How does a run chart differ from a frequency distribution in terms of the information it reveals?
Run charts show when variation occurs, while frequency distributions show how often variation occurs.
Run charts show how often variation occurs, while frequency distributions show when variation occurs.
Both run charts and frequency distributions show only how often variation occurs.
Both run charts and frequency distributions show only when variation occurs.
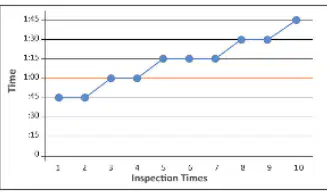
If the inspection times on a run chart gradually increase or decrease over time, what does this indicate?
The process is stable and no action is needed.
There is a special cause variation worth investigating.
The standard inspection time is being maintained.
The data is not continuous.
What would you expect to see on a run chart if the standard inspection time is one minute and the process is stable?
The line should stay around the one-minute mark.
The line should gradually increase over time.
The line should gradually decrease over time.
The line should show random spikes and drops.
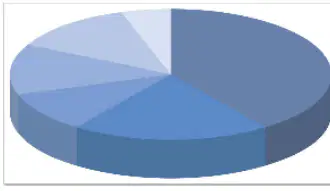
You are asked to show how a whole is divided into different categories, such as the market share of different companies. Which chart would be most appropriate?
Pie chart
Frequency distribution
Run chart
Histogram
When determining the success of a Six Sigma project, what does a company primarily look at?
The numbers and data from the project.
The opinions of the project team.
The length of the project timeline.
The amount of documentation produced.

