
 Worksheets
Population Growth SW
Total questions: 25
Worksheet time: 1hrs 9mins
When a population sees more births than deaths the population is _____.
growing
Shrinking
Not growing
Emigrating
Review: What is the carrying capacity of a population?
The most individuals a population that can be supported from the environment
How much weight a population can carry
The amount of food needed to fee a population
When a population grows without stopping

Review: What type of growth curve is shown in the picture?
Logistic
Exponential
What is a limiting factor?
Something that causes the growth of a population to decrease
Something that causes a population to grow a lot
Limiting factors that affect large, dense populations more than small, scattered populations are called ________________.
Density dependent limiting factors
Density independent limiting factors
What limiting factors do not usually depend on population density?
Natural disasters like a flood
Predators
Competition
Disease
Which of the following would be considered a density dependent limiting factor?
Floods
Tornadoes
Predators
Earthquake
The COVID-19 pandemic is an example of what type of limiting factor?
Density dependent
Density independent
Arctic foxes eat Arctic hares. What would happen to the hare population if the fox population increased rapidly?
The hare population would decrease
The hare population would increase
There would be no change on the hare population
An earthquake occurs in California and kills 500 people. Is this an example of a density dependent or independent limiting factor?
Independent
Dependent

Review: What type of growth curve is shown in the picture?
Logistic
Exponential
What is the abbreviation for carrying capacity?
r
C
K
a
S curve
J curve
M curve
W curve
S curve
J curve
M curve
W curve
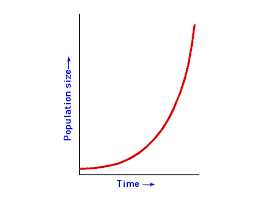
What type of growth is shown in the diagram?
exponential growth
logistic growth
predator-prey cycle
boom-bust curve
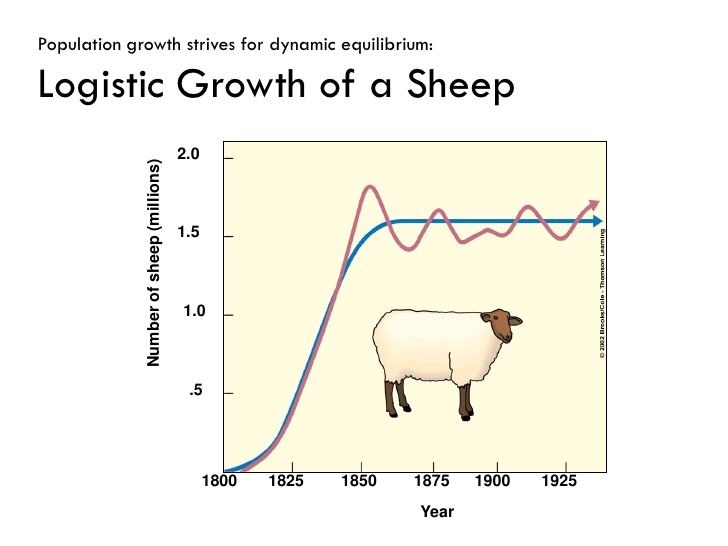
What is the carrying capacity for this sheep population?
2.0 million
1.0 million
1.6 million
0.5 million

What is the approximate carrying capacity of Paramecium aurelia grown alone?
100
200
300
450
Limiting factors are sometimes helpful because they can keep the population from getting to large.
True
False
Graph that shows the likelihood of death for an individual.
Exponential curve
Logistic curve
Survivorship curve
Carrying capacity

Results when two or more organisms need the same resource
Natality
Exponential growth
Competition
Poaching

Describes organisms with a low death rate early on due to high levels of parental care and few offspring. Examples include people and elephants
Type I
Type II
Type III
Type IV
During one year, two rabbits were born into a population and five emigrated to look for better food sources. Seven rabbits died in the population and 12 immigrated into the population.
What was the population growth during this year?
Use this formula:
population growth = (birth rate + immigration) – (death rate + emigration)
-10
2
7
26

Clumped Dispersion- ____________ in some places, absent in others.
Scattered
Equal distance
grouped

Uniform Dispersion- About _______ apart, forming a pattern.
Scattered
Equal distance
grouped

Random Dispersion-____________, not uniform.
Scattered
Equal distance
grouped

