
NEW
Font size
 Worksheets
Data Quality Problems Introduction
Total questions: 10
Worksheet time: 5mins
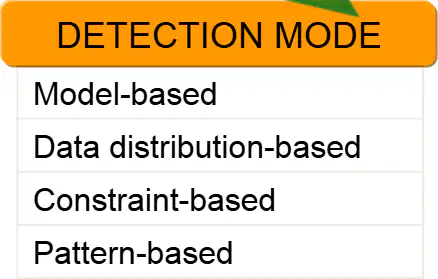
Which option best describes a detection mode that checks values against predefined rules like valid ranges or formats?
Pattern-based detection mines frequent motifs
Data distribution-based detection compares histograms
Constraint-based detection enforces explicit rules
Model-based detection uses fitted simulations
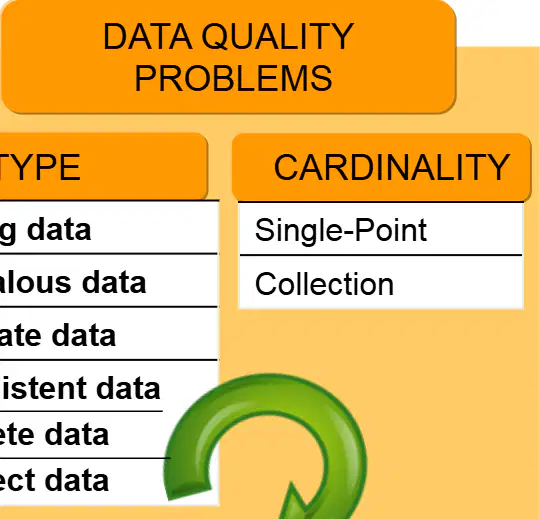
A dataset contains two identical customer records after a batch import. What type of data quality problem is this, and what is its likely cardinality?
Anomalous data with single-point cardinality
Duplicate data with collection cardinality
Incorrect data with single-point cardinality
Obsolete data with collection cardinality
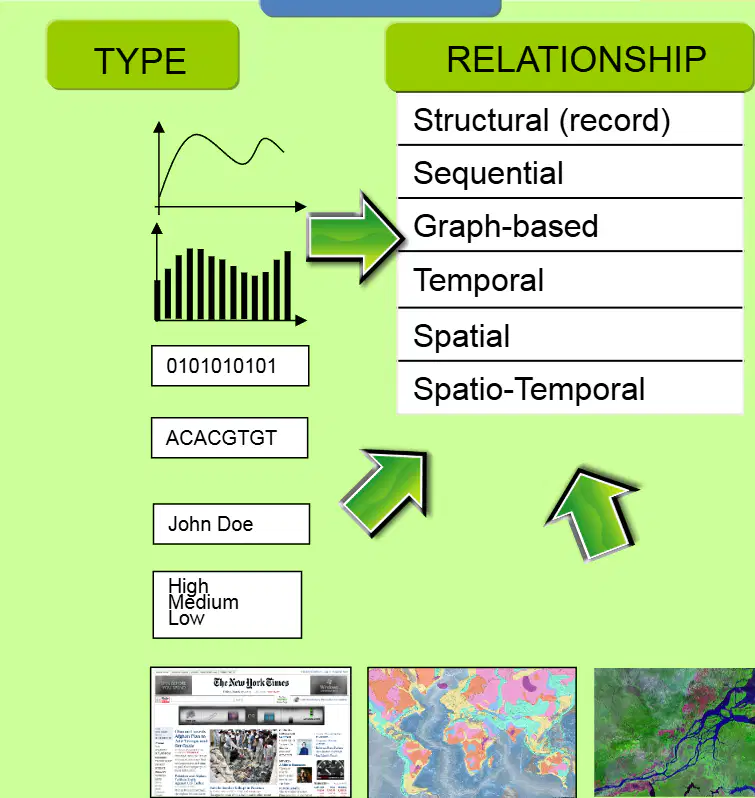
You are monitoring sensor readings over time and suspect subtle drifts across days rather than a single bad value. Which relationship and detection mode pairing is most appropriate to investigate?
Structural records with model-based detection
Graph-based data with constraint-based detection
Temporal sequences with data distribution-based detection
Spatial data with pattern-based detection
Which best describes a misfielded value in a relational table?
A NULL value in a required column
A correct value stored in the wrong column
A misspelled value in the same column
A duplicated value across multiple rows
In the committee table, a phone number like 74415567 under the Tel column most likely indicates which issue?
Bivariate dependency between name and city
Outlier due to extreme numeric magnitude
Duplicate record for the same person
Inconsistent formatting across similar fields
When detecting outliers using bivariate analysis, which rule is illustrated by the green box on the X–Y plot?
Apply Mahalanobis distance using covariance of X and Y
Select points beyond three standard deviations only
Exclude points inside the inner quartile rectangle
Keep points within 2%–98% quantiles for X and Y
Why can multivariate analysis flag different outliers than bivariate analysis in the scatterplots shown?
It uses wider quantile thresholds for each axis
It disregards correlations and treats axes separately
It accounts for covariance across variables jointly
It replaces numeric distances with categorical bins
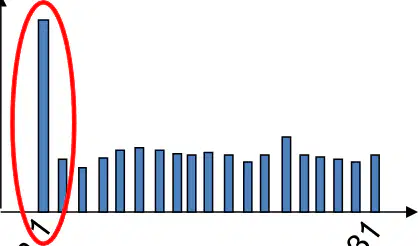
Which scenario best illustrates disguised missing data detectable through a distribution anomaly, as shown in the diagrams?
Birthdates clustered on January first week only
Evenly spaced ages from teens to nineties
Slightly higher births on summer weekends
Uniform birthdates across all calendar days
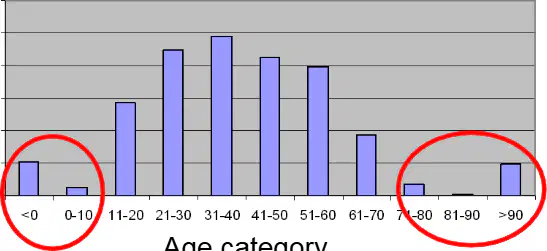
In the age-category histogram for online shoppers, which categories would most likely signal a data-entry or coding issue rather than a true pattern?
<0 and >90 age buckets near zero
61–70 bucket moderately lower than peak
31–40 and 41–50 buckets near 400
21–30 bucket slightly above average

Two news items report and then retract a CEO’s death. What is the most appropriate data-quality action before updating a critical dashboard?
Verify with multiple authoritative sources first
Post immediately and correct later if needed
Rely on a single well-known outlet only
Ignore all reports until next month’s cycle

