
 Worksheets
Page 1
Total questions: 80
Worksheet time: 40mins
Directions (1–15): What approximate value should come in place of question mark (?) in the following questions? (√625.021 + √1599.78) + (560.31% of 30 − 250.23% of 62) = ?
2
3
4
5
6
Directions (1–15): What approximate value should come in place of question mark (?) in the following questions? ? = 729.11 ÷ 26.97 × 81.11 ÷ 35.91 × 108.18
2187
6561
729
243
81
Directions (1–15): What approximate value should come in place of question mark (?) in the following questions? ?2 + (32.08)2 − 144.44 × (7.99)2 = 72.9% of 401.1
3
12
8
4
6
Directions (1–15): What approximate value should come in place of question mark (?) in the following questions? 47.87% of 350 + 60.11% of 280 = 96.98% of 299.78 + ?% of 150
30
40
50
80
45
Directions (1–15): What approximate value should come in place of question mark (?) in the following questions? 2?=128.18×511.77÷2047.59+31.89×15.91
−4
6
8
5
4
Directions (1–15): What approximate value should come in place of question mark (?) in the following questions? 59.77% of 880 + 79.9% of 591 = ?
1000
950
1100
1050
900
Directions (1–15): What approximate value should come in place of question mark (?) in the following questions? 13.9×6.01 ÷ 41.89 = ? ÷ 5.9
15
12
25
7
18
Directions (1–15): What approximate value should come in place of question mark (?) in the following questions? 899 ÷ 44.8×4.05×69.8 = ?
6300
5000
5600
5800
6000
Directions (1–15): What approximate value should come in place of question mark (?) in the following questions? 44.44÷4.4÷10.1=(?)2÷100
10
14
20
15
25
Directions (1–15): What approximate value should come in place of question mark (?) in the following questions? 4.9×11.9 + 8.9 = ? ÷ 3.9 ÷ 11.1
87
91
77
74
84
Directions (1–15): What approximate value should come in place of question mark (?) in the following questions? 1999.92÷49.87×3.01+5.13=(?)3
5
8
9
2
3
Directions (1–15): What approximate value should come in place of question mark (?) in the following questions? 59.9%×319.94+9.99%×1600.01=−177+(?)2
26
33
23
20
40
Directions (1–15): What approximate value should come in place of question mark (?) in the following questions? 1.101 + 11.01 + 101.01 ÷ 1.01 = ?
109
116
101
113
117
√2024 × √9.21 − 35.01 = ? × 10.1
10
12
14
20
15
1390.98 ÷ 26.04 × 1.99 = ? − 162
324
413
400
343
363
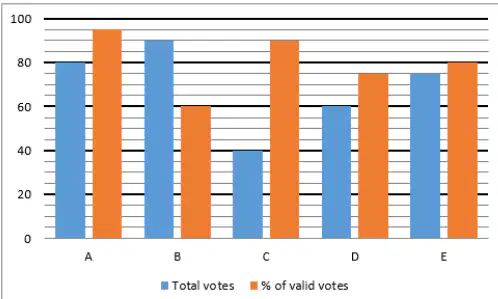
Directions: Study the bar chart which shows total votes (in '000) in five cities (A, B, C, D, E) and the percentage of valid votes out of total votes in these cities, then answer: In A, ratio of valid votes received by BJP, INC and SP is 11 : 3 : 5. If BJP wins the election by 24000 votes, find valid votes received by INC and SP together.
28000
40000
45000
32000
21000
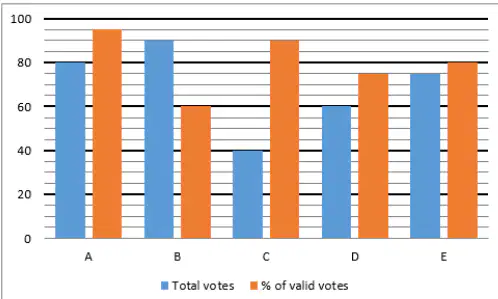
Directions: Study the bar chart which shows total votes (in '000) in five cities (A, B, C, D, E) and the percentage of valid votes out of total votes in these cities, then answer: In D there are only two parties, BJP and INC, and BJP got 70% of the total valid votes. Find by how many votes BJP won the election in D.
18000
25000
10000
16000
6000
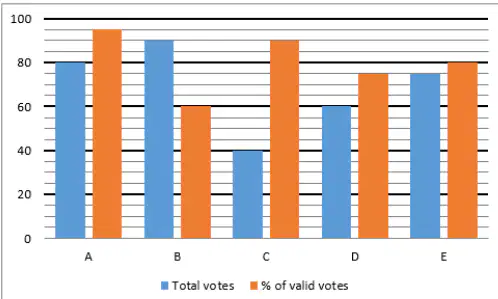
Directions: Study the bar chart which shows total votes (in '000) in five cities (A, B, C, D, E) and the percentage of valid votes out of total votes in these cities, then answer: If in E INC got 15000 more valid votes than AAP and BJP won the election by 15000 votes, find the valid votes received by BJP. (There are only three parties in E – BJP, INC and AAP)
40000
38000
45000
35000
30000
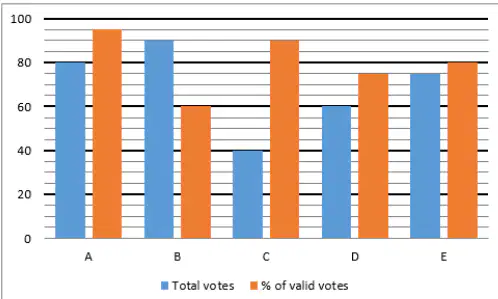
Directions: Study the bar chart which shows total votes (in '000) in five cities (A, B, C, D, E) and the percentage of valid votes out of total votes in these cities, then answer: In B there are only two parties – BJP and INC. If BJP got 60% of total votes in B and the ratio of invalid votes received by BJP and INC is 2 : 1, then find valid votes received by INC in B.
24000
27000
22000
20000
25000
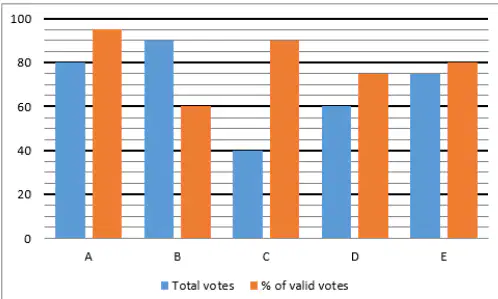
Directions: Study the bar chart which shows total votes (in '000) in five cities (A, B, C, D, E) and the percentage of valid votes out of total votes in these cities, then answer: In C there are four parties – BJP, INC, SP and AAP. If the ratio of valid votes received by BJP, INC, SP and AAP in C is 4 : 2 : 3 : 3 and the ratio of invalid votes received by BJP, INC, SP and AAP in C is 1 : 3 : 4 : 2, then find the difference between total votes received by INC and SP in C.
2000
3500
3400
2100
2700
What is the difference between average number of students of school A across all the years and the average number of students of school B across all the years?
18
10
12
14
16
Find the respective ratio of the total number of students of school A in 2011 and 2012 together to the total number of students of school C in 2013 and 2014 together?
31:33
47:55
55:47
33:31
31:37
If in 2016, the total number of students in School A, School B and School C increases by 10%, 20% and 15% respectively as compared to 2015, then find the total number of students in 2016 in all the schools together?
850
870
780
830
800
Total students of all the school together in 2013 is approximately what percentage more/less than the total students of school B in 2011 and 2015 together?
52%
59%
56%
63%
48%
Find the difference between the number of total students from all the schools in 2011 and 2013 together and the total number of students from all the schools in 2014 and 2015 together?
140
60
120
80
100
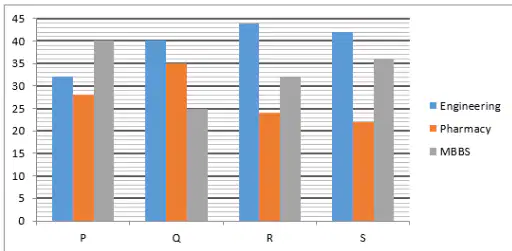
Given bar graph shows the percentage distribution of total number of students of each school (P, Q, R & S) who took admission in 3 different streams. Total students in P, Q, R & S are 700, 800, 400 and 900 respectively. What is average number of students who have opted for MBBS in all the 4 colleges?
256
233
284
224
296
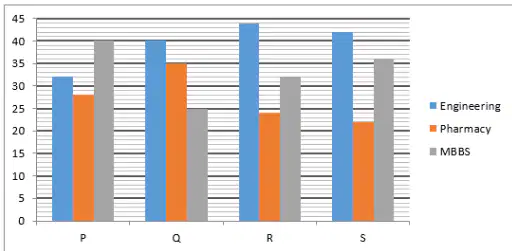
Given bar graph shows the percentage distribution of total number of students of each school (P, Q, R & S) who took admission in 3 different streams. Total students in P, Q, R & S are 700, 800, 400 and 900 respectively. What is the ratio of the total number of student who have opted for both engg. and MBBS stream together in college Q to that of in same stream together in college R?
38:65
67:35
35:67
65:38
29:37
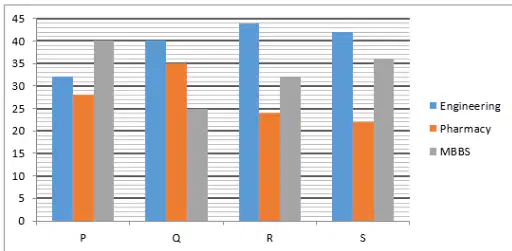
Given bar graph shows the percentage distribution of total number of students of each school (P, Q, R & S) who took admission in 3 different streams. Total students in P, Q, R & S are 700, 800, 400 and 900 respectively. The number of student who have opted for MBBS in college P is what percent of the number of students who have opted for the engg. in college Q?
87.5%
50%
75%
100%
62.5%
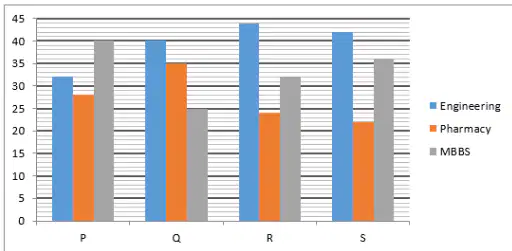
Given bar graph shows the percentage distribution of total number of students of each school (P, Q, R & S) who took admission in 3 different streams. Total students in P, Q, R & S are 700, 800, 400 and 900 respectively. What is the ratio of the no. of students who have opted for engg. in college R to that of those who have opted for same stream in college P?
14:11
17:13
11:14
13:17
None of these
Which of the combination represents the colleges with maximum number of students, who have opted for pharmacy and those who have opted for engineering respectively?
P & R
Q & S
Q & R
R & S
P & Q
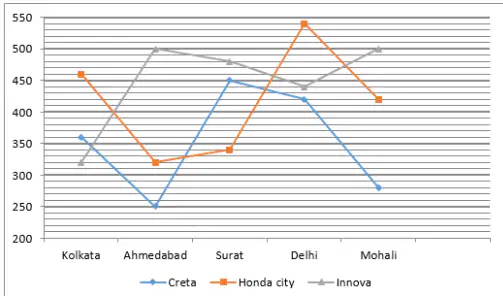
Following line graph shows the data of 3 different types of cars (Creta, Honda City, Innova) sold in 5 different cities (Kolkata, Ahmedabad, Surat, Delhi, Mohali). Number of Honda City cars sold in Ahmedabad is what percent of total Innova cars sold in Surat?
50%
66 2/3%
70%
57 1/7%
80%
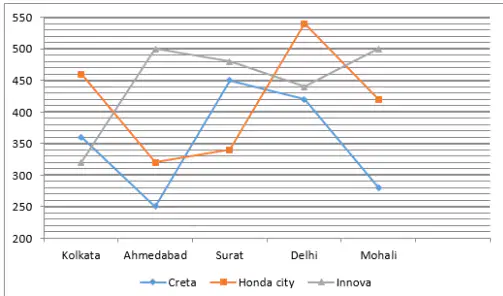
Following line graph shows the data of 3 different types of cars (Creta, Honda City, Innova) sold in 5 different cities (Kolkata, Ahmedabad, Surat, Delhi, Mohali). Find the respective ratio of Creta cars sold in Delhi and Mohali together to the total of Innova cars sold in Kolkata and Ahmedabad together.
41:35
46:53
26:35
35:41
35:54
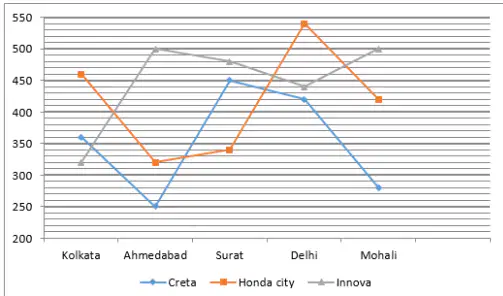
Following line graph shows the data of 3 different types of cars (Creta, Honda City, Innova) sold in 5 different cities (Kolkata, Ahmedabad, Surat, Delhi, Mohali). Find the total number of cars sold in Kolkata.
1140
1170
1250
1300
1080
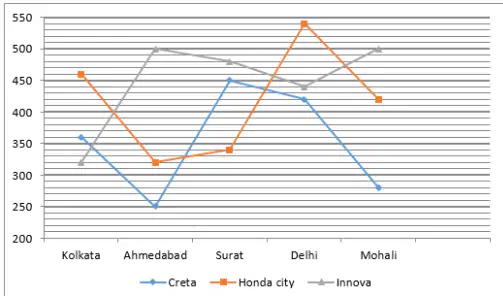
Following line graph shows the data of 3 different types of cars (Creta, Honda City, Innova) sold in 5 different cities (Kolkata, Ahmedabad, Surat, Delhi, Mohali). Find the difference between number of Honda City cars sold in Delhi and number of Creta cars sold in Surat.
70
110
80
100
90
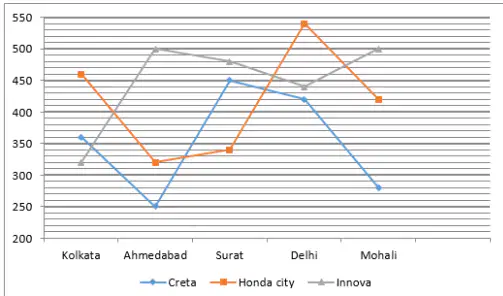
Following line graph shows the data of 3 different types of cars (Creta, Honda City, Innova) sold in 5 different cities (Kolkata, Ahmedabad, Surat, Delhi, Mohali). Find the average number of Honda City cars sold in all the cities.
420
426
416
430
435
What is difference between average marks scored by Student A and Student B in all subjects?
1.75
1.45
1.50
1.25
1
What is Ratio of marks obtained by Student A in Maths and Computer together to the marks obtained by Student B in Science and English together?
7:5
7:8
8:7
8:5
5:7
What is the overall percentage marks scored by Student B?
68.75 %
67.5 %
68%
67%
69.25%
Marks Scored by Student A in Math is what percent of marks scored by Student B in Science and English together?
40%
60%
50%
70%
80%
If passing marks for each subject is 40% of 120, then what is the difference between passing marks and marks scored by Student B in Computer?
30
32
36
40
45
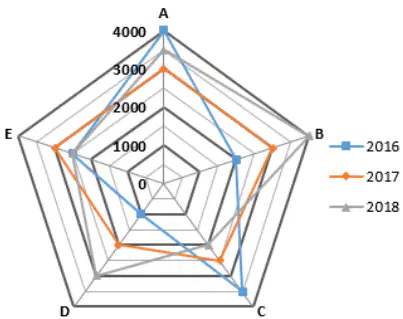
Study the radar chart showing the number of buses manufactured by 5 different companies (A, B, C, D & E) in 2016, 2017 & 2018. Note – Buses manufactured by a company in any year = (Sold + unsold) buses of that company in that year. If company – B sold 80%, 90% and 80% buses manufactured by it in 2016, 2017 & 2018 respectively, then find average number of unsold buses of company – B in 2016, 2017 & 2018.
400
900
500
200
100
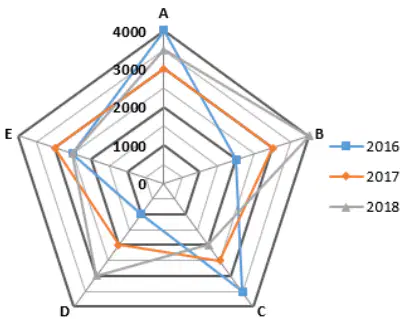
Study the radar chart showing the number of buses manufactured by 5 different companies (A, B, C, D & E) in 2016, 2017 & 2018. Note – Buses manufactured by a company in any year = (Sold + unsold) buses of that company in that year. Buses manufactured by company – A in 2016 & 2018 together are what percent more or less than buses manufactured by company – D in 2017 & 2018 together?
50%
90%
70%
60%
80%
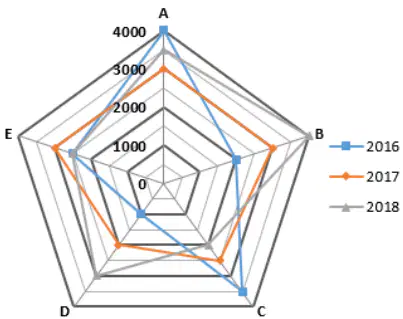
Study the radar chart showing the number of buses manufactured by 5 different companies (A, B, C, D & E) in 2016, 2017 & 2018. Note – Buses manufactured by a company in any year = (Sold + unsold) buses of that company in that year. If buses sold by company – B and company – E in 2016 are 75% and 80% respectively, then find ratio of buses sold by company – B & E together in 2016 to unsold buses of company – B & E together in 2016.
11 : 5
5 : 1
8 : 5
7 : 2
None of the above.
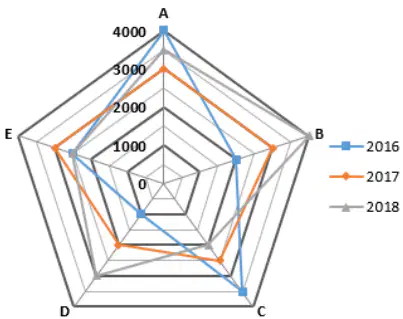
Study the radar chart showing the number of buses manufactured by 5 different companies (A, B, C, D & E) in 2016, 2017 & 2018. Note – Buses manufactured by a company in any year = (Sold + unsold) buses of that company in that year. If company – B sold 80%, 90% and 80% of its manufactured buses in 2016, 2017 & 2018 respectively, then find the average number of unsold buses of company – B in 2016, 2017 & 2018.
400
900
500
200
100
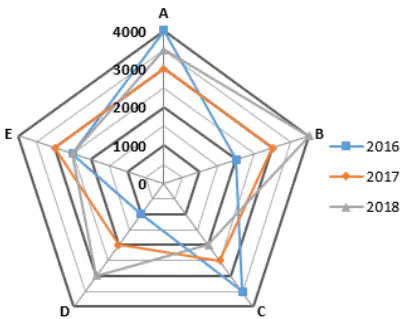
Directions (41-45): Study the radar chart showing the number of buses manufactured by 5 different companies (A, B, C, D & E) in 2016, 2017 & 2018. Note – Buses manufactured by a company in any year = (Sold + unsold) buses of that company in that year. Answer this based on the chart: Buses manufactured by company – A in 2016 & 2018 together are what percent more or less than buses manufactured by company – D in 2017 & 2018 together?
50%
90%
70%
60%
80%
Buses manufactured in 2018 by all these five companies together are approximately what percent of buses manufactured in 2016 by all these five companies together?
104%
108%
102%
118%
115%
Average number of buses manufactured by company B, C and D in 2017 are how much more or less than buses manufactured by company D and E together in 2016?
1500
2500
2000
1000
500
Directions: Find the missing term in the following number series questions. 6, 7, 16, 51, 208, ?
970
845
1085
985
1045
Directions: Find the missing term in the following number series questions. 2000, ?, 2164, 2308, 2504, 2760
2049
2036
2064
2100
2081
Directions: Find the missing term in the following number series questions. 800, 770, 728, 672, ?, 510
616
600
580
624
560
Directions: Find the missing term in the following number series questions. 500, 548, 620, ?, 836, 980
716
736
756
696
746
10, 20, 60, 300, ?, 23100
1650
1500
1800
2100
2400
3, 8, 18, 33, 53, ?
72
80
76
78
73
9, 64, 25, 216, ?, 512
49
343
81
100
121
12, 36, 80, 164, 328, ?
648
664
660
656
652
15, 23, 30, 36, 41, ?
48
52
49
45
51
7, 14, 28, ?, 112, 224
56
64
58
62
60
250, 375, 591, ?, 1446, 2175
954
934
914
894
974
30, 90, 360, 1800, 10800, ?
54000
73200
72800
75600
64800
39600, 6600, ?, 330, 110, 55
1320
1650
1100
1160
1280
200, ?, 236, 284, 380, 572
228
208
224
220
212
8000, 7100, 6475, 6075, ?, 5750
5975
5850
5675
5875
5775
1528 + 525 ÷ 25 – 840 = 510 + ?
199
299
159
189
165
1225 ÷ 7 + 18.5 × 16 – 18% of 10800 = ? – 1800
259
169
157
129
141
65% of 180 + ?% of 210 = 80% of 225
45
30
40
50
25
1500+?+17.5×8−5% of 20=42
145
115
120
135
125
1713 of 1568 of 153 = ?
8
12
7
6
4
? + 25 + 141 = 181 + 225 + 741
871
873
865
863
781
251725+1213025+1248312=(?)2
17
23
15
13
11
(180 × 170) ÷ 16 ÷ ? = 153 × 6 + 612
1.75
1.20
1.25
1.45
1.80
Solve the equation: (24)2−(12)2−(10)2+(?)2=207×3
19
37
13
23
17
Compute the value of: (1285+215−720)+(1620+1200−69.5×40)
23.5
13
21.5
17.5
19.5
In an alloy A, Aluminum and Nickel are present in the ratio 4 : 3 and in alloy B, the same elements are in the ratio 3 : 5. If these two alloys are mixed to form a new alloy in which the same elements are in the ratio 1 : 1, find the ratio of alloy A and alloy B in the new alloy.
6 : 7
7 : 4
4 : 7
7 : 6
4 : 3
The average weight of boys in a school is 60 kg while the average weight of girls is 55 kg. The average weight of both boys and girls is 58 kg. Find the number of girls in the school if the number of boys is 720.
480
720
240
360
600
If 21 is added in a number, the result becomes 11632% of itself. Find the new number.
126
147
130
136
125
The amount invested by P and Q is in the ratio 2 : 3 and that invested by P and R is 5 : 7. If the profit earned by P at the end of the year is Rs. 76 less than that earned by R, find the profit earned by Q.
Rs. 95
Rs. 228
Rs. 285
Rs. 380
Rs. 114
Average weight of A, B and C is 93 kg. If another man D joins the group whose weight is 81 kg then the new average of the four people will be equal to:
65 kg
67 kg
86 kg
90 kg
96 kg
An article when sold at 54 of its original selling price gives a profit of 20%. Find the profit % when the same article is sold at its actual selling price.
15 %
20 %
25 %
22 %
None of these
An amount of Rs. 20000 when invested at R% simple interest for 2 years becomes Rs. 24000. What will it become in 3 years if invested at (R+2)% ? (in Rs.)
27200
26300
25200
27400
28100
Karan purchased an article marked up by 50% at a discount of 20% but later he found that the article was having a defect so he decided to return it but the shopkeeper returned him only 90% of what he had paid. What is profit/loss (in %) of the shopkeeper in the whole transaction?
8
10
12
15
None of these

