
 Worksheets
Linear Regression & Inequalities
Total questions: 18
Worksheet time: 1hrs 12mins

A restaurant sells pizza for the prices in the data table. Calculate the linear regression equation of the data.
y = 1.5x + 12
y = 12x + 1.5
y = 0.67x - 8
y = -8x + 0.67


The annual profits for a company are given, where x represents the number of years since 1992, and y represents the profit in thousands of dollars. Write the linear regression equation that represents this set of data, rounding all coefficients to the nearest hundredth. then, use the equation to estimate the year in which
the profits would reach 378 thousand dollars.
2029
2014
2003

The number of newly reported crime cases in a county in New York State is shown, where x represents the number of years since 1994, and y represents the number of new cases. Write the linear regression equation that represents this set of data, rounding all coefficients to the nearest hundredth. Then, use this equation to find the projected number of new cases for 2003, rounded to the nearest whole number.
974
25,101
940
952

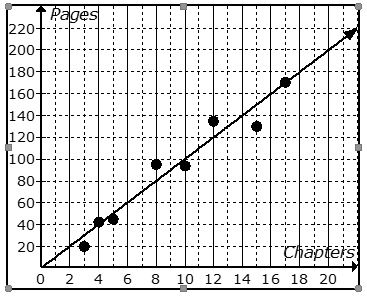
The scatter plot shows the relationship between the number of chapters and the total number of pages for several books. Use the trend line to PREDICT how many chapters
would be in a book with 180 pages.
If x is temperature and y is coffee sales, use the following formula to determine the coffee sales on a 34° day.
y = -60x+6443
$4403
$4673
$8483
$6443

Write the equation for the linear regression shown.
y=ax+b
y=0.6x+0.1
y=0.72x+r
y=0.1x+0.6
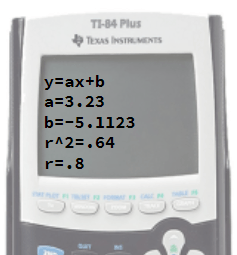
Write the equation for the linear regression shown.
y=−5.11x+3.23
r=0.8
y=3.23x − 5.11
y=0.64x+0.8


Which with is the line of best fit?
A) Black
B) Orange
C) Red
D) Blue

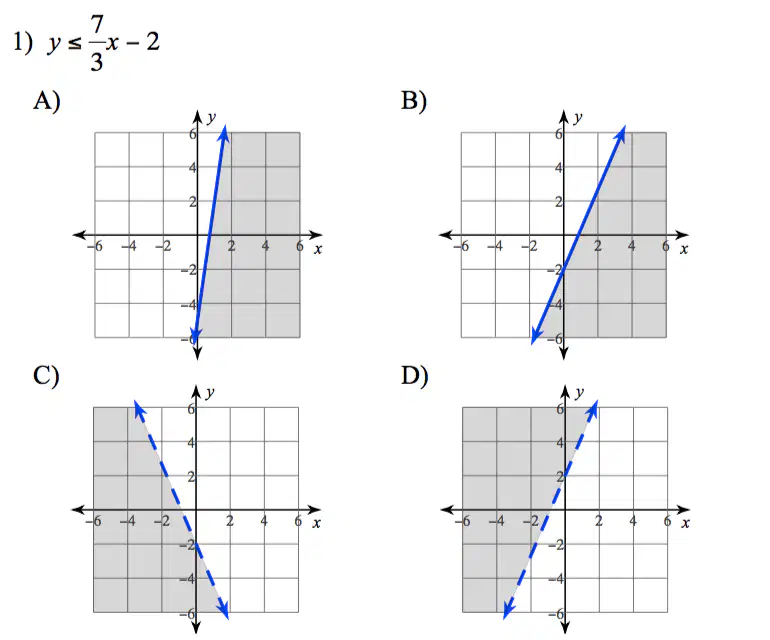
Which graph matches the inequality?

which equation best represents this graph?
y < 1/2x + 1
y < 1/2x + 2
y >1/2x + 2
y > 2x

Identify the inequality.
y > 2
y ≤ 1
x ≥ 2
y ≥ 1

Identify the inequality.
y > x+1
y ≤ 1x+1
y ≥ x+1
y ≤ x-1
-3x ≥ 12

Is the point (1, 2) a solution for the following inequality? Choose the best answer that has the best explanation.
Yes because it is located in the shaded region.
No because it is located on the line and the line is dotted.
Yes because it is located on the line.
No because it is in the shaded region.

