
 Worksheets
REVIEW QUIZ RESEARCH G9
Total questions: 40
Worksheet time: 20mins
What are the two branches of Statistics?
Engineering and Chemistry
Inferential and Descriptive
Mathematical and Inferential
Hard and Easy
A group of subjects selected from a population is a __.
Data
Group
Portion
Sample
A __ consists of all subjects (human or otherwise) that are being studied.
Exam
Population
Sample
Study
It is a branch of statistics consisting of generalizing from samples to populations, performing estimations and hypothesis tests, determining relationships among variables, and making predictions.
Descriptive
Inferential
Mathematical
Population
It is a type of inferential statistic used to determine if there is a significant difference between the means of two groups, which may be related to certain features.
ANOVA
Chi-Square
Standard Deviation
t-Test
What is the purpose of a t-test?
To test for significant difference between group means
To analyze categorical data
To perform regression analysis
To calculate the median of a dataset
Which of the following is the nature of the data for t-test?
There can be only one variable of interest
Numerical Variable
Normal Distribution
All of the above
Which type of t-test is used to compare a sample mean to a predefined/critical value?
ANOVA
Independent sample t-test
One-sample t-test
Paired t-test
What is the assumption for the data in a one-sample t-test?
Data should be approximately normally distributed
Data should be randomly selected
There should be significant outliers
Data should be categorical
What is this H0 symbol called?
Alternative Hypothesis
Associative Hypothesis
Null Hypothesis
Simple Hypothesis
Which of the following scenarios is appropriate for a dependent t-test?
Comparing the test scores of two different classes
Comparing the pre-test and post-test scores of the same group of students
Comparing the heights of men and women
Comparing the sales figures of two different stores
What is another name for the dependent t-test?
Independent t-test
One-sample t-test
Paired sample t-test
Two-sample t-test
A student measures the heart rate of participants before and after a physical exercise routine. Which statistical test should they use to analyze the data?
ANOVA
Chi-square test
Dependent t-test
Independent t-test
In a science investigatory project, which scenario would be appropriate for using an independent t-test?
Comparing the blood pressure of patients before and after a new medication
Measuring the weight of individuals at two different times
Comparing the reaction times of participants before and after consuming caffeine
Comparing the test scores of two different groups of students taught with different teaching methods
A researcher wants to compare the effectiveness of two different fertilizers on plant growth by using two separate groups of plants. Which statistical test should they use?
ANOVA
Chi-square test
Dependent t-test
Independent t-test
In a project measuring the impact of a dietary supplement on athletes' performance, the same athletes are tested before and after taking the supplement. What is the alternative hypothesis for the dependent t-test?
The mean difference in performance before and after taking the supplement is not zero
There is no difference in performance before and after taking the supplement
The variances of the two groups are equal
The samples are from the same population
Which of the following is an assumption that must be met for a dependent t-test?
The samples are independent
The differences between paired observations are normally distributed
The samples have equal variances
The samples are from different populations
A project aims to compare the average reaction times of two different age groups under the same conditions. What is the null hypothesis for the independent t-test?
There is no difference in the average reaction times between the two age groups
The mean difference in reaction times is zero
The variances of the two groups are equal
The samples are from the same population
What is the null hypothesis for an independent sample t-test?
The data is not normally distributed
The sample sizes of both groups are equal
The sample means of both groups are significantly different
The sample means of both groups are the same
Direction: Read and analyze the questions given. Shade the corresponding letter of your answer on your answer sheet. What is the purpose of a paired sample t-test?
To analyze categorical data
To perform factor analysis
To compare the means of two different samples or groups
To compare the means of two related samples or groups
What hypothesis indicates that THERE IS A MEAN DIFFERENCE between two independent samples, and is denoted by the symbol Ha?
Alternative Hypothesis
Associative Hypothesis
Null Hypothesis
Simple Hypothesis
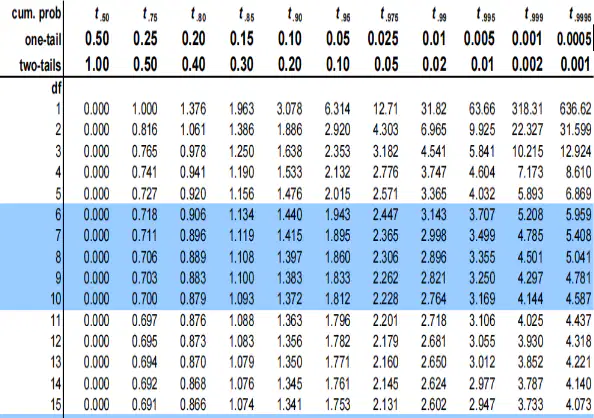
If the significance level of the two‑tailed t‑Test is 0.05 and the degrees of freedom is 6, what is its critical value? Use the t‑table given.
1.943
2.365
2.447
3.143
Which of the following assumptions is NOT required for conducting an Independent Sample t‑test?
Equal variances
Dependent samples
Normality of the data
Random sampling
Which of the following is the formula for independent t‑test?
t = D̄ / S_D
t = √[((Σx₁² − (Σx₁)²/N₁)/(N₁−2)) + ((Σx₂² − (Σx₂)²/N₂)/(N₂−2)) × (1/N₁ + 1/N₂)]
t = ΣD² − (ΣD)²/N
t = Σx² / √[N(N−1)]

Problem: Consider a study which compares the percentage of particulate matter present before and after installation of luffa filter in the exhaust pipe of diesel engine cars (α = 0.05). Based on the table of paired observations (cars A–F) with BEFORE and AFTER values and the computed differences D and D², what is the level of significance in the problem?
0.001
0.01
0.05
0.10

Problem: Consider a study which compares the percentage of particulate matter present before and after installation of luffa filter in the exhaust pipe of diesel engine cars (α = 0.05) (paired measurements for cars A–F). What is the value of ΣD?
36.99
41.65
45.32
49.98

Problem: Consider a study which compares the percentage of particulate matter present before and after installation of luffa filter in the exhaust pipe of diesel engine cars (α = 0.05) (paired measurements for cars A–F). Solve for the value of ΣD².
353.40
375.13
396.85
465.85

Problem: Consider a study which compares the percentage of particulate matter present before and after installation of luffa filter in the exhaust pipe of diesel engine cars (α = 0.05) (paired measurements for cars A–F). Calculate the sum of squares of the difference Σ(d²) in % particulate matter.
11.08
11.24
11.32
11.45

Problem: Consider a study which compares the percentage of particulate matter present before and after installation of luffa filter in the exhaust pipe of diesel engine cars (α = 0.05) (paired measurements for cars A–F). Solve for the standard error of the mean difference (SD).
0.55
0.61
0.65
0.78

Problem: Consider a study which compares the percentage of particulate matter present before and after installation of luffa filter in the exhaust pipe of diesel engine cars (α = 0.05) (paired measurements for cars A–F). Calculate D̄.
7.40
7.50
7.55
8.00

Problem: Consider a study which compares the percentage of particulate matter present before and after installation of luffa filter in the exhaust pipe of diesel engine cars (α = 0.05) (paired measurements for cars A–F). What is the computed t‑value in the problem?
10.26
10.93
11.69
12.38

Problem: Consider a study which compares the percentage of particulate matter present before and after installation of luffa filter in the exhaust pipe of diesel engine cars (α = 0.05) (paired measurements for cars A–F). What would be the interpretation if the researcher used 2.571 as the tabular value?
Fail to Reject the Null Hypothesis
Reject the Null Hypothesis
Claim the Alternative Hypothesis is true
Undecided

For the given table of independent samples below, calculate the sum of the column for group 1 (Σx₁).
30
35
40
45

For the same independent samples table, find the sum of the squared values of group 2 (Σx₂²).
47
60
95
251

For the same independent samples table, what is the degree of freedom?
4
5
7
9

For the same independent samples table, determine the value of N for the two groups.
5 and 4
10 and 8
35 and 13
35 and 4

For the same independent samples table, find the first group mean value x̄₁.
5.25
7.00
8.60
9.75

For the same independent samples table, which of the following is the mean value of the second group x̄₂?
2.00
3.25
3.75
5.00

For the same independent samples table, calculate t.
2.58
4.52
6.14
7.12

For the same independent samples table, what would the interpretation be if the researcher used 2.365 as the tabular value?
Fail to Reject the Null Hypothesis
Reject the Null Hypothesis
Claim the Alternative Hypothesis is true
Undecided

