Data and statistics
Comparing data displays
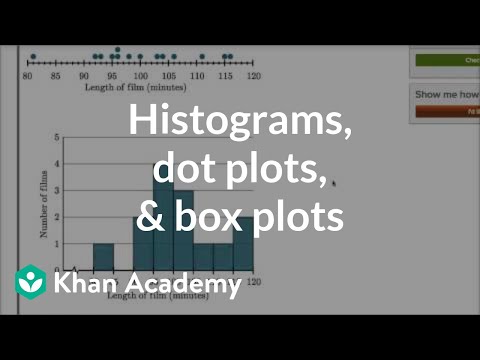
Explore how to analyze and compare various data displays using dot plots, histograms, and box plots to identify patterns, trends, and distributions in data sets.
200+ videos and assessments
Standards aligned
Vetted by experts
Start adapting your curriculum in minutes.
The best way to create, adapt, and deliver resources differentiated for every student.
