Displaying and comparing quantitative data
Describing and comparing distributions
Students learn to describe and compare data distributions, enhancing skills in analyzing trends and variability, using engaging mathematical techniques.
200+ videos and assessments
Standards aligned
Vetted by experts
VIDEOS
Shapes of distributions
Khan Academy
•9th - 12th Grade
•10 Qs
Clusters, gaps, peaks & outliers
Khan Academy
•6th - 8th Grade
•10 Qs
Comparing distributions with dot plots (example problem)
Khan Academy
•7th - 10th Grade
•10 Qs
Comparing dot plots, histograms, and box plots
Khan Academy
•6th - 6th Grade
•9 Qs
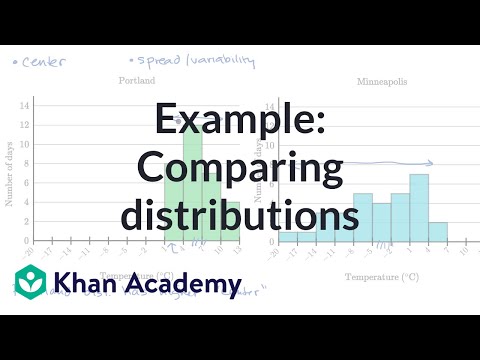
Example: Comparing distributions
Khan Academy
•9th - 12th Grade
•10 Qs
Start adapting your curriculum in minutes.
The best way to create, adapt, and deliver resources differentiated for every student.
